Is a home solar installation a good investment? What does it cost to install solar panels?
If you’re like most homeowners considering installing solar panels, then these questions are likely top of mind.
Although every solar installation will be unique, Learning from Home Solar Power – Year 1, seeks to provide insightful answers to these questions so you can better understand what to expect.
PLEASE READ: A&R Solar is publishing this post with generous permission from John: the owner and author of Seek Nuance.
QUICK LINKS
Home Solar Installation
Cost to Install Solar Panels
Solar Power System Energy Production
Electric Bill Reduction
Solar Payback Period
Solar ROI
Home Solar Installation
As of two days ago, I’ve owned a residential solar power system for one year.
To help others make decisions about solar panels for your home, and to reward the four people who follow this blog, I’m going to report on how it did in the first year.
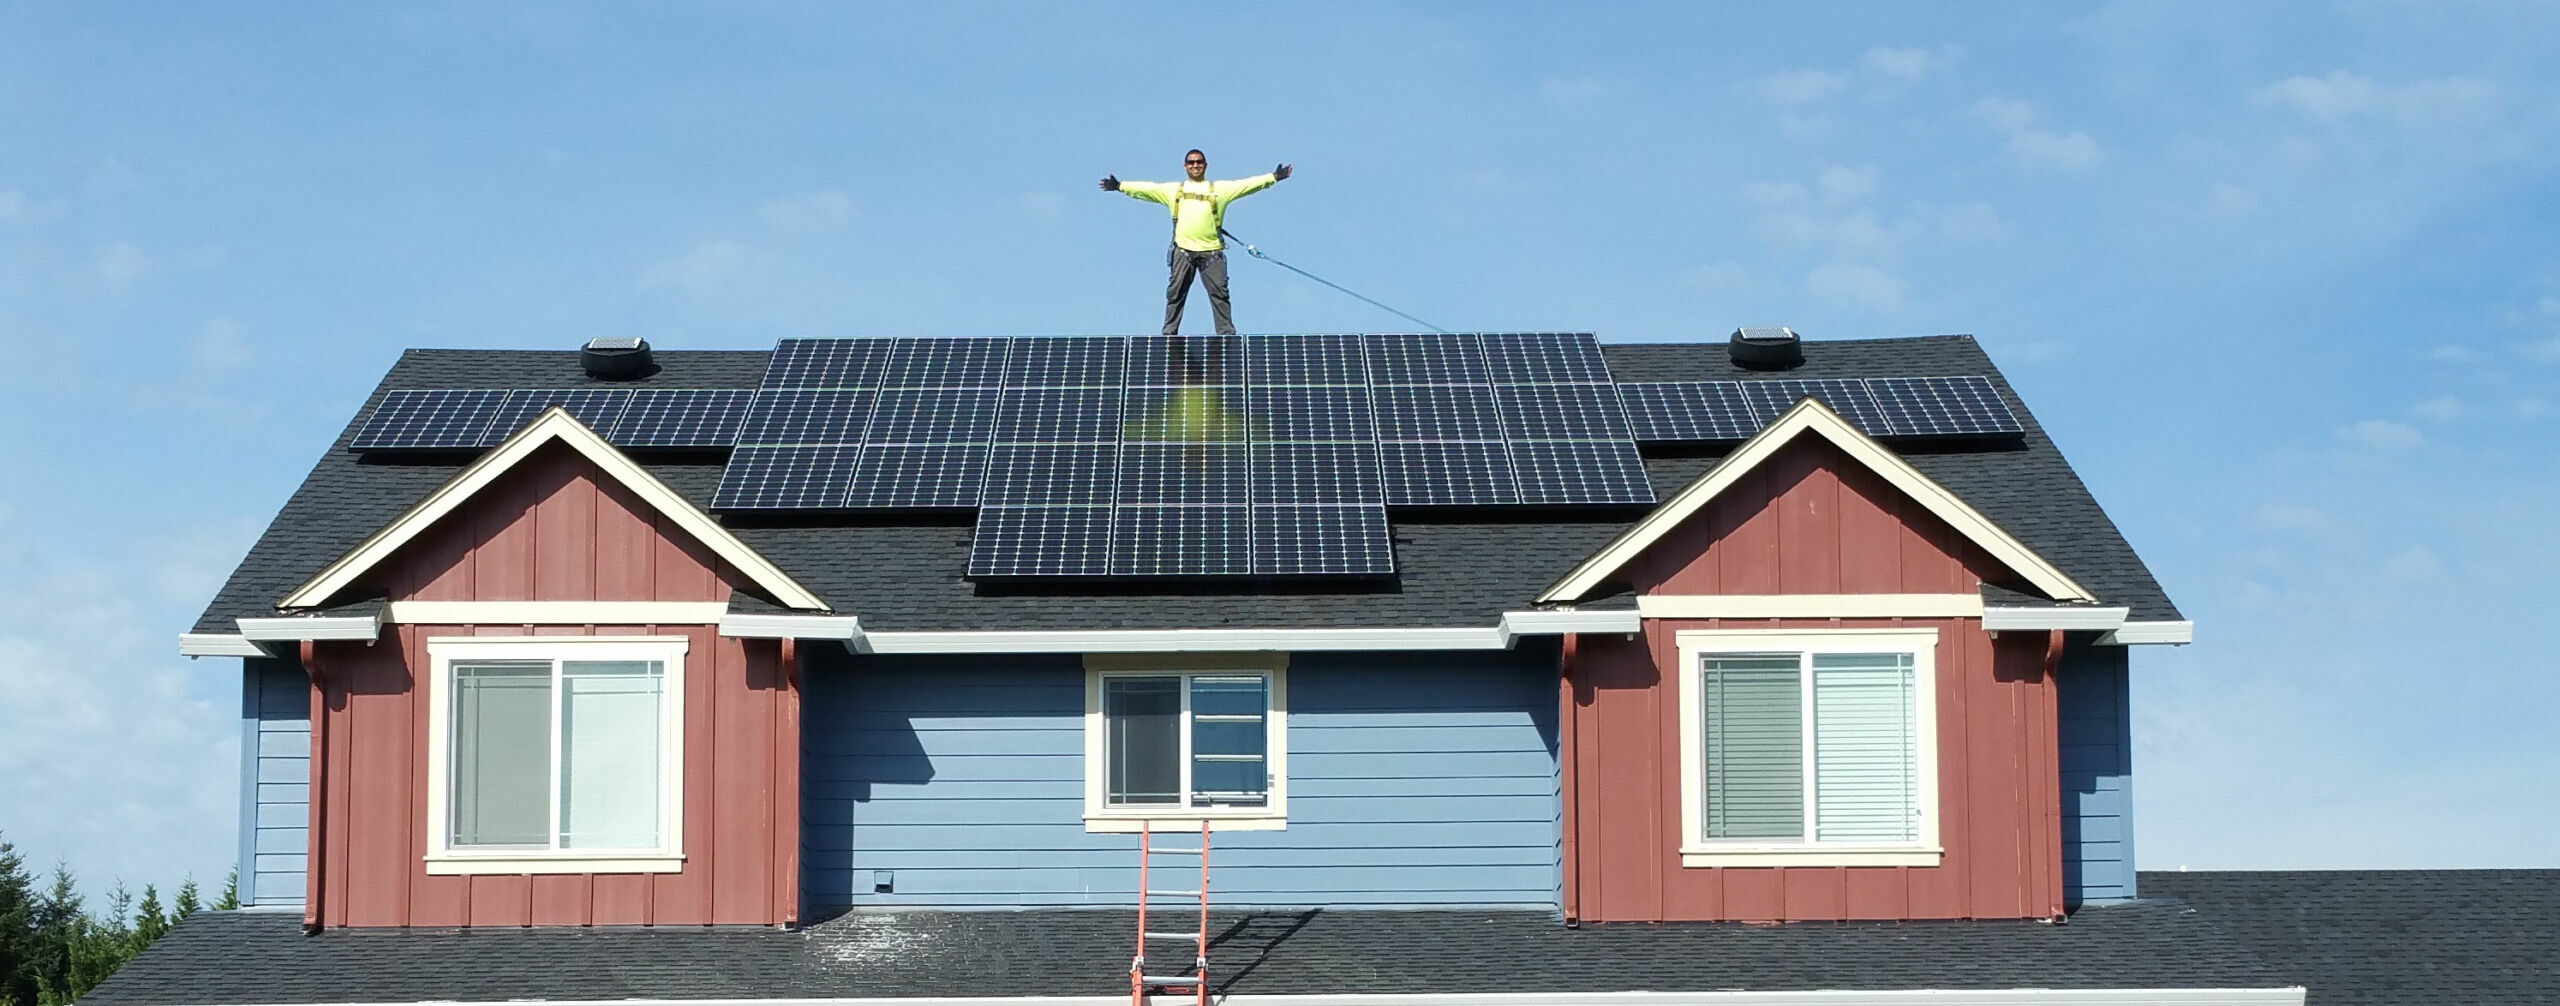
My solar energy system is 31 405W REC Alpha-Pure 405W panels mounted on my roof with a SolarEdge inverter system. Its installation was completed, and it was connected to the grid, on September 22, 2022.
I have 1:1 net metering with an annual balance clear every March 31. We are projected to generate less energy than our annual use, so the annual clearing is not an issue.
But we did change our behavior this year because of a heightened awareness of our electric usage… We’ve started drying our clothes outside on a clothesline! It’s a small portable unit intended for use when camping and is just the right size for two people. It’s saved us a lot of electricity but we still expect to use more than our photovoltaic system generates. If that turns out to be false and we lose some banked kWh on March 31, I’ll amend this analysis.
Cost to Install Solar Panels
The solar installation cost, net of Federal tax incentives, was $40,862 * .7 = $28,603. (This was less than the estimate I originally published.)
I earned a $500 referral fee from A&R Solar that I’ll fold into the net cost, with the reasoning that I wouldn’t have earned the referral credit unless I had installed the system.
So the real net solar installation cost was $28,103.
Maintenance costs: Zero!
Cleaning costs: Zero! I sometimes noticed dust on the panels (probably from the smoke of forest fires in eastern Washington and Canada) as well as the occasional bird dropping. All of them are on an incline, so I counted on rain showers to clean them off, which they did. I considered spraying them with a hose but decided the likely benefit wasn’t worth the hassle.
Solar Power System Energy Production
Total solar energy production over the past 365 days: 12.5 MWh.
The 31 solar panels are arrayed on five different roof faces. Here’s their energy production for the year. There’s some round-off error so let’s not nitpick about that.
My house’s walls, and therefore rooves, are skewed about 30 degrees off magnetic north.
The western-facing roof generated the most solar energy, at 486 kWh per panel for the year. Those panels are highlighted in a light blue color.
I was surprised that the eastern-facing roof generated the least energy, at 335 kWh per panel. I thought it would mirror the western-facing roof but shade from trees and a neighbor’s house limited its output.
I was also surprised by the strong showing of the three panels near our chimney — they’re in the lower-right corner. They are mostly south-facing, but I expected the chimney’s shadow would eliminate that advantage. Nope, they kicked butt.
Here’s the solar energy production by month and by quarter.
SolarEdge doesn’t provide a “past N days” graph, so you have to do some mental gymnastics. The production starts at the first blue column in September, goes to the end of the graph on the right, wraps around to the left side of the graph in January 2023, and then ends in September 2023.
While the energy of Q3Y2022 + Q3Y2023 is close to the Q2 production, the monthly production surprised me. I expected June to be the high month since it contains the longest day of the year. Nope! Cloudy and rainy days, and forest fire haze, prevented that. July was the highest monthly production, with a significant reduction in August.
Electric bill reduction
Seattle City Light bills are designed for the typical homeowner and not someone who’s grinding numbers. If I had CT monitors installed then I could produce numbers with higher accuracy. I did capture kWh readings at the SolarEdge inverter every other month and at the year’s end. Beyond that, I’m working from the normal Seattle City Light bills, the SolarEdge site, and Apple Numbers.
My average cost in the past 365 days was $0.128/kWh. That’s my estimate from the bills. The SolarEdge server says my system generated 12.5 MWh. Some of that offset my current electric bills and some was banked for future savings as part of 1:1 net metering.
If I count the value of the banked kWh, which will help offset my next one or two electric bills, then it generated $1,600 in savings over the past year. I think this is correct because the offset savings will occur soon and I’ll be careful to not double-count it next year.
Solar Payback Period
This is the most common way to evaluate the worthiness of home improvements. It’s flawed but let’s start with it.
If all future years are like the past year, then the break-even period is 18 years including the federal tax incentive. That’s not great.
But future years won’t be like the past year. The panels’ output will decrease to 92.0% of their first-year output over the next 25 years. And the cost of electricity is expected to rise. The conventional wisdom is that the cost of electricity will rise more than the panels’ output will decrease, so the cost savings actually increase with each passing year.
If that happens then we can say the break-even period is less than 18 years including the federal tax incentive. Still not great. But I would call it minimally acceptable.
Solar ROI
IMHO a better way is to consider it an investment and compare it to other investments.
I invested $28,103, net of the tax incentives, and I got back $1,600 in savings including the banked kWh. That’s a 5.7% ROI.
That’s 5.7% tax-free with zero fees and very low risk.
This is better than any tax-free investment available in September 2022. Even today, with rising interest rates, T-bills are hitting 5.25% and tax-free bonds are hitting 5.06%.
So if I treat these as the tax-free low-risk part of an investment portfolio, from an ROI perspective this system is a win. And because of the likely increase in savings with each passing year, the effective rate of return will increase with each year. Still tax-free and very low-risk.