TL;DR
The solar payback period is the amount of time it takes for your solar savings to equal the net cost of your system.
Your actual payback timeline depends on your system cost, electricity rate, financing, utility policy, system production, and how much energy your home uses. That is why a custom estimate matters more than a generic average.
Payback is useful, but it is not an exact science. Electricity rates change. Utility policies change. Your household energy use may change too.
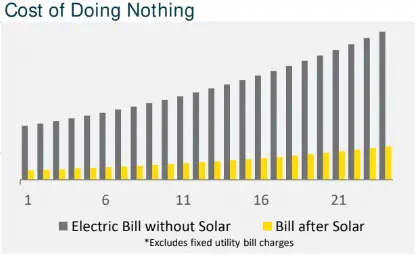
That is why solar should be evaluated over the full life of the system. A solar system can produce electricity for 25 years or more, so the better question is not just “When do I break even?” It is “How does the cost of solar compare with 25+ years of utility electricity costs?”
What is the solar payback period?
The solar payback period tells you when your solar investment breaks even.
The basic formula is:
Solar payback period = net system cost ÷ annual electricity savings
Your net system cost is the installed price after any qualifying rebates, exemptions, or incentives. Your annual electricity savings come from the power your system produces, the electricity you avoid buying from the utility, and any bill credits you receive through net metering.
For example, if your system costs $25,000 and saves you $2,000 per year, your estimated payback period is 12.5 years.
After that point, your system can keep generating savings for years.
Why payback matters
Payback gives homeowners a simple way to understand when solar starts producing a financial return.
It helps answer a practical question:
How long until my savings catch up to what I paid?
That is useful when you are comparing quotes, deciding whether to pay cash or finance, or trying to understand whether solar makes sense for your home.
But payback has limits. It does not show total lifetime savings. It does not fully account for rising utility rates. And it does not tell you whether one system is better designed, better built, or more reliable than another.
Use payback as a starting point, not the final verdict.
Why solar payback is not an exact science
The solar payback period is an estimate, not a guarantee.
That does not make it useless. It just means you need to understand what the estimate is based on. Payback depends on your system cost, your home’s energy use, your utility rate, your system’s production, your financing terms, and how electricity prices change over time.
That last part matters more than many homeowners realize.
Your solar system is not just competing against today’s utility bill. It is competing against 25 years or more of future electricity costs.
In Washington and Oregon, electricity rates have increased significantly in recent years. Utilities are investing in aging infrastructure, wildfire mitigation, transmission upgrades, grid reliability, and clean-energy requirements. Those investments show up in customer rates.
Puget Sound Energy customers have already seen major approved electric rate increases. Washington regulators approved PSE rate changes that raised a typical residential electric customer’s bill by about 12% in 2025, with another 6.3% increase expected in 2026.
In Oregon, Pacific Power has also received recent rate increases tied in part to infrastructure investment, wildfire-related costs, transmission needs, and renewable energy projects.
Those pressures are unlikely to disappear. Washington law requires utilities to move toward greenhouse gas-neutral electricity by 2030 and 100% renewable or zero-carbon electricity by 2045. Oregon’s clean energy law requires major emissions reductions from electricity providers by 2030, 2035, and 2040.
Those goals are important. They also require continued investment in the grid.
That is why a simple payback calculation can understate the long-term value of solar.
A better question is:
What will this solar system cost me, and how much utility electricity cost can it help me avoid over the next 25 years or more?
Payback still matters. It gives you a useful break-even estimate. But it should not be the only number you use.
A strong solar proposal should also show:
- Your total system cost
- Your estimated annual production
- Your estimated first-year savings
- Your estimated lifetime savings
- The utility rate increase assumptions used in the calculation
- Your financing costs, if you are using a loan
- Battery costs, if storage is included
The goal is not to predict the future perfectly. No one can do that. The goal is to understand the range of possible outcomes and make a decision based on long-term value.
A system with a longer payback period may still be a smart investment if it helps reduce your exposure to rising electricity costs and continues producing power for decades.
How to calculate your solar payback period
To estimate your payback period, you need four numbers:
- Total installed system cost
- Confirmed rebates, exemptions, or incentives
- Estimated annual electricity savings
- Ongoing costs, if any
Here is a simple example:
| Item | Example |
|---|---|
| Gross solar installation cost | $28,000 |
| Confirmed rebates, exemptions, or incentives | -$3,000 |
| Net system cost | $25,000 |
| Estimated annual electricity savings | $2,000 |
| Estimated payback period | 12.5 years |
In this example, the homeowner breaks even in about 12 and a half years. If the system keeps producing for 25 years or more, that leaves more than a decade of additional savings after payback.
What affects your solar payback period?
Solar payback varies from home to home. These are the biggest factors.
Electricity rates
Electricity rates are one of the biggest drivers of solar payback.
The more you pay for electricity, the more valuable your solar production becomes. If utility rates rise over time, the electricity your system produces can become more valuable too.
This is especially important in Washington and Oregon. Utilities are investing in grid reliability, aging infrastructure, wildfire mitigation, transmission upgrades, and clean-energy requirements. Those costs can contribute to higher electric rates over time.
That does not mean anyone can predict future utility rates perfectly. They cannot. But it does mean homeowners should be careful about using flat-rate assumptions when evaluating solar. If your payback estimate assumes electricity prices never rise, it may understate the long-term value of your system.
System cost
Installed cost has a major impact on payback. A higher-priced system needs more years of savings to break even.
For many Washington and Oregon homeowners, residential solar systems commonly fall somewhere in the $17,000 to $34,000 range, depending on system size, equipment, roof conditions, electrical work, and project complexity.
That said, the cheapest quote is not always the best investment. Equipment quality, workmanship, design accuracy, warranties, and installer reliability all matter.
Energy use
Your savings depend on how much electricity your home uses and how much of that use your system can offset.
A home with higher electric bills may see stronger annual savings. A highly efficient home may still benefit from solar, but the annual savings may be smaller.
Your energy use may also change over time. If you add an electric vehicle, heat pump, induction stove, hot tub, or battery system, your future electricity needs may look different from your current utility bill.
Solar production
Production depends on roof orientation, shading, pitch, system size, panel quality, and local weather.
In the Pacific Northwest, solar works well, but accurate production modeling matters. A good estimate should reflect your actual roof and location.
Net metering
Net metering can improve solar savings.
When your system produces more power than your home uses, the excess electricity goes back to the grid. Depending on your utility’s policy, you may receive bill credits for that exported power.
Those credits can shorten your payback period.
Incentives
Incentives, exemptions, and rebates can reduce your net cost and improve payback.
These programs change over time and vary by state, utility, and project type. Before relying on any incentive in your calculation, confirm that your project qualifies.
Financing
Financing changes the math.
If you pay cash, payback is straightforward. You are measuring how long it takes to recover your upfront cost.
If you finance the system, you also need to compare your monthly loan payment with your monthly electricity savings. A financed system may have a longer technical payback period but still improve monthly cash flow.
Example solar payback scenarios
These simplified examples show how the math works. Your actual cost and savings will depend on your home, utility, roof, system size, equipment, and financing.
| Scenario | Net system cost | Annual savings | Estimated payback |
| Smaller system or lower-usage home | $17,000 | $1,400/year | 12.1 years |
| Mid-range Pacific Northwest system | $25,000 | $2,000/year | 12.5 years |
| Larger system or higher-usage home | $34,000 | $2,700/year | 12.6 years |
| Higher-rate utility or higher offset | $30,000 | $3,200/year | 9.4 years |
The takeaway: payback is not one-size-fits-all. A lower-cost system does not automatically have the best payback, and a higher-cost system is not automatically a worse investment.
What matters is how the total system cost compares with the amount of utility electricity the system helps you avoid over 25 years or more.
Solar payback vs. solar ROI
Payback and ROI are related, but they are not the same.
Payback tells you when you break even.
ROI tells you how much value the system creates over time.
A system with a longer payback period may still produce power for decades. That means the homeowner may receive years of savings after reaching break-even.
A fuller solar financial analysis should also look at:
- Lifetime savings
- Utility rate increases
- Net present value
- Financing costs
- Equipment warranties
- Panel degradation
- Battery storage costs, if included
- Future electricity needs, such as EV charging or home electrification
This matters because the fastest break-even point is not always the same thing as the strongest long-term value.
How should you evaluate your solar payback period?
There is no universal “good” solar payback period.
A payback estimate only makes sense when you understand the assumptions behind it. Two homeowners in the same city can have very different payback periods because their homes, roofs, energy use, utility rates, financing terms, and system designs are different.
Instead of asking whether a specific payback period is “good,” ask better questions:
- What total system cost is this estimate based on?
- How much electricity is the system expected to produce each year?
- What utility rate was used to calculate savings?
- Does the estimate assume utility rates will rise over time?
- How does financing affect monthly cash flow and total cost?
- How much electricity cost could the system help avoid over 25 years or more?
- Does the system support future energy needs, such as EV charging, heat pumps, or battery storage?
Payback is one useful number. It is not the whole decision.
The stronger way to evaluate solar is to compare the cost of the system with the long-term cost of buying electricity from the utility. That gives you a clearer view of lifetime value, not just the break-even point.
Common mistakes homeowners make
Comparing gross cost instead of net cost
Always compare system cost after confirmed incentives, rebates, or exemptions.
Trusting production estimates without checking assumptions
Ask how the installer calculated production. A good estimate should include shading, roof pitch, orientation, utility usage, and local weather.
Assuming electricity rates will stay flat
If utility rates rise, your solar savings may grow over time. Simple payback can understate long-term value when it does not account for future rate increases.
Choosing the cheapest quote by default
A low price does not help if the system underproduces, uses weaker equipment, or comes with poor service after installation.
Forgetting financing costs
If you finance, interest and loan terms affect your return. Ask for both simple payback and monthly cash-flow projections.
How A&R Solar helps homeowners understand payback
A&R Solar designs solar and battery systems for homeowners across Washington and Oregon. Your payback estimate should reflect your home, your utility, your roof, your energy use, and the incentives currently available to you.
A strong solar proposal should explain:
- How much electricity your system is expected to produce
- How much of your utility bill the system may offset
- Which incentives or exemptions apply
- How net metering affects your savings
- What your estimated payback period looks like
- How financing changes monthly cash flow
- What your long-term savings may look like
- What utility rate increase assumptions are included
Solar is a long-term investment. The right number is not a national average. It is the number that fits your home.
Key takeaways
| Point | What it means |
| Solar payback period | The time it takes for solar savings to equal your net system cost |
| Basic formula | Net system cost divided by annual electricity savings |
| Biggest drivers | Electricity rates, system cost, incentives, production, and utility policy |
| Payback limitation | It shows break-even timing, not total lifetime value |
| Long-term view | Solar should be compared with 25+ years of utility electricity costs |
| Better decision metric | Look at payback, lifetime savings, ROI, financing, and system quality together |
FAQ
What is the solar payback period?
The solar payback period is the amount of time it takes for your electricity bill savings to equal the net cost of your solar system.
How do you calculate solar payback?
Divide your net system cost by your estimated annual electricity savings. For example, if your system costs $25,000 and saves $2,000 per year, your payback period is about 12.5 years.
What is a good solar payback period?
There is no single “good” solar payback period. Payback varies by system cost, energy use, utility rates, financing, incentives, roof conditions, and system design. A better approach is to compare your system cost with the amount of utility electricity cost it may help you avoid over 25 years or more.
Does solar payback vary by state?
Yes. Solar payback varies by electricity rates, incentives, sunlight, system costs, and utility policies. Washington and Oregon homeowners should use local utility rates and state-specific policies when estimating payback.
Why do electricity rates matter for solar payback?
Electricity rates affect how much your solar production is worth. If utility rates rise over time, the electricity your system produces may become more valuable, improving your long-term savings.
Does financing change solar payback?
Yes. If you finance your system, you should compare your monthly loan payment with your monthly electricity savings. Simple payback is most accurate for cash purchases.
What happens after solar pays for itself?
After your system reaches payback, your ongoing electricity savings become part of your return. Most solar panels are designed to keep producing power for decades.
Is solar payback the same as ROI?
No. Payback tells you when you break even. ROI tells you how much value the system creates over the full life of the system.
Why do two solar quotes show different payback periods?
Different installers may use different assumptions for system cost, production, utility rates, incentives, and electricity rate increases. Ask each installer to show the assumptions behind the estimate.
Is solar payback an exact number?
No. Solar payback is an estimate based on current costs and future assumptions. The best proposals show the assumptions behind the estimate, including system production, utility rates, financing, and long-term savings.