

TL;DR:
Many homeowners in the Pacific Northwest underestimate the importance of home efficiency and proper system design when going solar. A thorough readiness assessment, optimal inverter choices, and utility billing strategies are essential for maximizing savings and system performance. Choosing a qualified contractor and modeling for resilience further ensure long-term value and reliable energy independence.
Many Washington and Oregon homeowners install solar panels expecting immediate, significant savings, only to find their bills drop less than projected. The Pacific Northwest presents real challenges: variable cloud cover, shading from tall trees, and net metering policies that vary by utility. These factors, combined with the complexity of system design and contractor selection, mean that going solar is just the first step. Getting your system to consistently deliver on its financial promise requires a deliberate, informed approach, and that is exactly what this guide provides.
Table of Contents
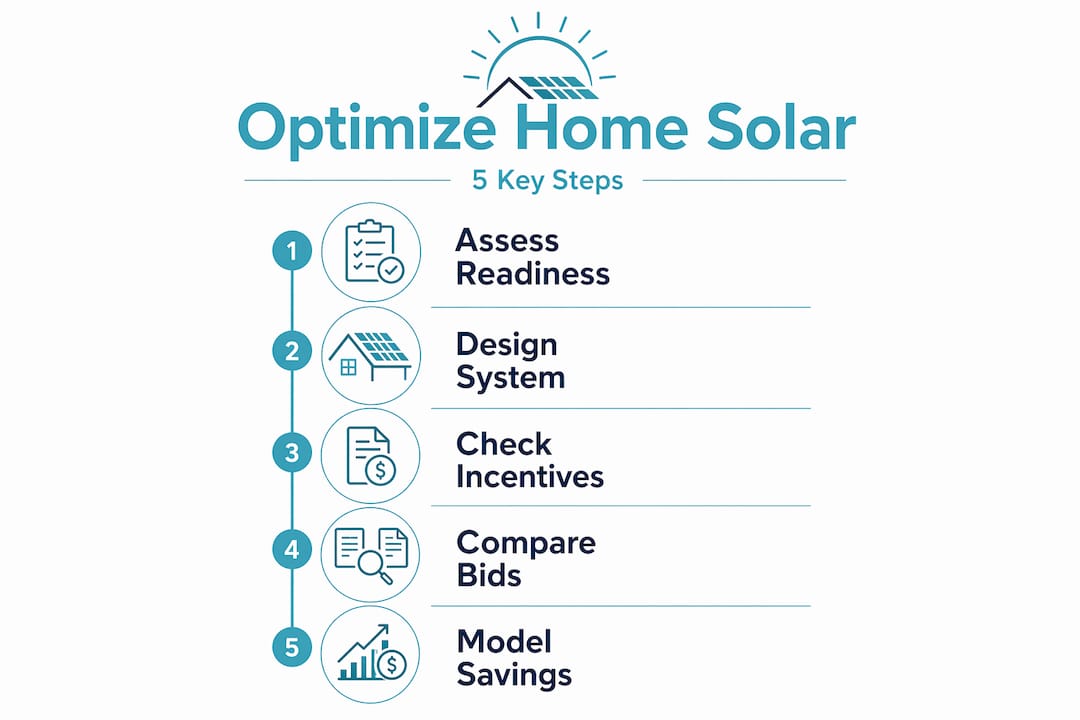
- Evaluate your home’s solar readiness
- Choose the best system design for Pacific Northwest conditions
- Maximize savings with utility billing and system sizing
- Compare contractor bids and avoid costly mistakes
- Model your system for resilience and smart energy use
- The biggest solar optimization mistake most homeowners make
- Ready to optimize your home solar system?
- Frequently asked questions
Key Takeaways
| Point | Details |
|---|---|
| Start with efficiency | Home efficiency upgrades lower total solar costs by reducing the system size you’ll need. |
| Design for shade | Microinverters or optimizers boost performance where shading varies, common in the Northwest. |
| Follow the economics | Utility billing policies strongly shape the best system size and how much you save over time. |
| Vet your contractor | Comparing detailed bids and avoiding aggressive sales tactics helps assure good value and system longevity. |
| Model for resilience | Use modeling tools to gauge backup needs and optimize system design for more than just annual output. |
Evaluate your home’s solar readiness
Once you recognize the value of optimizing your solar investment, the first step is confirming your home is well-prepared and efficiency-optimized before you ever add a single panel.
Many homeowners skip this stage and go straight to panel shopping. That is a costly oversight. Your roof, attic, windows, and appliances all affect how much solar energy you actually need and how efficiently your system will perform over time.
Start by reviewing these core readiness factors:
- Roof condition and age: Solar panels typically last 25 to 30 years. If your roof is more than 15 years old, replacing it before installation saves you thousands in future removal and reinstallation costs.
- Roof orientation: South-facing roofs capture the most sunlight in the Northern Hemisphere. West or east-facing arrays can still work well in the Pacific Northwest, but output will be lower.
- Shading analysis: Trees, chimneys, and neighboring structures create shade that disproportionately reduces panel output. A professional shade analysis identifies which hours and months shading is most severe.
- Home efficiency upgrades: Sealing air leaks, upgrading insulation, and switching to efficient appliances all reduce your baseline electricity demand. As the Solar Consumer Guide for Homeowners from Energy Trust of Oregon advises, evaluating whether efficiency upgrades can shrink the needed solar system size is a critical part of optimizing both cost and performance.
Home solar readiness overview
| Factor | What to check | Why it matters |
|---|---|---|
| Roof age | Under 15 years ideal | Avoids reinstallation costs |
| Orientation | South-facing preferred | Maximizes annual output |
| Shading | Trees, chimneys, vents | Shade can cut output 10-25% |
| Insulation | Attic and wall R-values | Reduces system size needed |
| Appliance efficiency | HVAC, water heater age | Lowers baseline demand |
| Past upgrades | Windows, smart thermostat | Already offset some load |
Pro Tip: Complete improving home energy efficiency upgrades first. Reducing your home’s energy demand means you can install a smaller, less expensive solar system while still covering your consumption. This single step can reduce your payback period by one to three years.
If you are exploring solar panels for your home for the first time, starting with a thorough readiness assessment prevents overspending and sets realistic expectations for savings from day one.
Choose the best system design for Pacific Northwest conditions
With your home ready, the next decision is choosing the right system design for the local climate and your property’s specifics.
The Pacific Northwest is not a uniform solar environment. Seattle receives about 136 sunny days per year on average. Portland fares slightly better, but both regions deal with extended overcast periods from October through March. This variability makes inverter technology and monitoring capability especially important for homeowners here.
Inverter technology comparison
| Inverter type | Best for | Shade tolerance | Monitoring level | Cost |
|---|---|---|---|---|
| String inverter | Unshaded, simple roofs | Low | System-wide only | Lowest |
| Microinverter | Shaded or complex roofs | High | Panel-level | Highest |
| Power optimizer | Mixed shade conditions | Medium-high | Panel-level | Moderate |
As noted in Solar Basics | Washington Solar, microinverters and power optimizers are often recommended in the Pacific Northwest specifically because they improve performance under partial-shade conditions and allow granular panel-level visibility for diagnostics.
Panel-level monitoring is particularly valuable here. When a single panel underperforms due to shading, debris, or a fault, a string inverter setup causes the entire string to drop to the weakest panel’s output. Microinverters and optimizers isolate each panel, so one problem does not drag down the whole system.
Key design considerations for PNW homeowners:
- Tilt angle: A tilt near your latitude (roughly 45 to 48 degrees in Washington) captures the most annual energy, though roof pitch is often the practical limit.
- Azimuth: True south orientation typically outperforms east or west by 10 to 15 percent annually in the Pacific Northwest.
- Array layout: Multiple small arrays on different roof faces can work well with microinverters, capturing morning and afternoon sun across orientations.
- Monitoring dashboard: Request a real-time monitoring platform from your installer. Most modern systems offer mobile apps showing daily, monthly, and annual production by panel.
Pro Tip: Ask your installer to provide sample screenshots or a demo of the monitoring dashboard before signing. Some platforms allow remote diagnostics, meaning your installer can identify a problem before you even notice a change in your utility bill. These tools are a core part of effective solar optimization strategies and tie directly into the performance you will see month after month.
For a detailed breakdown of the trade-offs between each option, the inverter technology guide from A&R Solar covers real-world performance in Northwest conditions.
Maximize savings with utility billing and system sizing
Beyond system hardware and site conditions, utility rate structures will determine your financial returns.
Net metering in Washington and Oregon is not uniform. Your utility’s tariff dictates how much credit you receive for power you send back to the grid. Some utilities offer retail-rate credits, meaning you get credited the same amount per kilowatt-hour you export as you would pay to import. Others, particularly for customers who exceed their monthly consumption, reduce credits to avoided-cost rates, which can be as low as 4 cents per kilowatt-hour compared to retail rates of 10 to 14 cents.
Rate reality check: Net metering rates in this region vary from approximately 4 cents per kilowatt-hour at avoided-cost to full retail rates. That difference directly changes how quickly your system pays for itself.
Because Oregon’s utility billing rules can significantly change the value of exported solar, optimizing for self-consumption versus export depends directly on the tariff structure your utility applies.
Steps to model optimal system size and billing strategy:
- Pull 12 months of utility bills. Identify your total annual kilowatt-hour consumption and note seasonal patterns.
- Identify usage peaks. High-demand months, often November through January, may be harder to offset due to reduced sun, shifting your sizing strategy.
- Request your utility’s current net metering tariff. Ask specifically about the credit rate for excess generation above monthly consumption.
- Size for self-consumption first. If your utility pays below retail for exported power, design the system to cover roughly 90 to 95 percent of your annual load rather than 110 percent.
- Model with your installer’s software. Ask for a production estimate report that shows expected annual kWh production, monthly breakdown, and estimated bill impact under your utility’s tariff.
Pro Tip: Review your utility bill for time-of-use patterns. If your utility charges higher rates during peak hours (typically late afternoon and evening), pairing solar with a battery lets you store midday generation and discharge it during peak hours, maximizing the effective value of every kilowatt-hour produced.
Reviewing available Oregon solar incentives can also change your system size decision. Tax credits, rebates, and incentive programs may shift the economics in favor of a slightly larger system, even under lower export credit structures.
Compare contractor bids and avoid costly mistakes
Once your design and sizing plans are set, the right contractor will make or break your project’s success and savings.
The solar industry includes excellent local installers and, unfortunately, some who rely on high-pressure tactics and unclear contract terms. Energy Trust of Oregon’s Solar Consumer Guide specifically recommends comparing contractor bids and being wary of aggressive sales or misleading contracts, noting the long-term impact on performance and cost outcomes.
“Not all solar quotes are equal. A lower upfront price can easily be offset by inferior warranties, undersized systems, or financing terms with high interest rates buried in fine print.”
Questions to ask every contractor before signing:
- What panel brand and model are you proposing, and what is the product warranty?
- What inverter type are you recommending, and why?
- What is the workmanship warranty on the installation itself?
- Who handles permits, and are permit fees included in the quote?
- What monitoring platform do you use, and will I have independent access?
- How long have you been operating in Washington or Oregon specifically?
- Can you provide three references from jobs completed in the last 24 months?
Red flags to watch for:
- Door-to-door sales with same-day signing pressure
- Contracts that allow the installer to change equipment without notification
- Financing with rates above 8 percent labeled as “low monthly payments”
- Vague production guarantees without a written methodology
Steps to finalize your contractor selection:
- Gather a minimum of three detailed, itemized bids covering equipment, labor, permits, and monitoring.
- Verify each contractor’s license with Washington’s Department of Labor and Industries or Oregon’s Construction Contractors Board.
- Check reviews on third-party platforms and ask for references from completed projects in your climate zone.
- Compare warranties side by side: panel product warranty, panel performance warranty, inverter warranty, and installer workmanship warranty.
- Read financing terms carefully if using a loan or lease, paying close attention to escalator clauses and interest rates.
For more guidance on selecting qualified solar installers in the Northwest, and for answers to solar questions for PNW homeowners, those resources cover the regional specifics that a generic guide often misses.
Model your system for resilience and smart energy use
For homeowners who want backup power or to gain additional value from timing, modeling is the final key to a fully optimized solar system.

Resilience means more than just saving money on sunny days. It means your home can power critical loads, like refrigeration, medical equipment, or heating, during grid outages. The Pacific Northwest experienced multiple outage events in recent years due to ice storms and wildfire-related grid stress, making battery backup an increasingly practical investment rather than a luxury.
Steps to model for resilience and time-of-use value:
- List your critical loads. Determine which appliances you need during an outage, such as the refrigerator, a well pump, medical devices, or lighting, and calculate their combined wattage.
- Estimate outage duration. Pacific Northwest grid outages from ice storms can last two to five days. Size battery capacity to cover critical loads for your target duration.
- Identify time-of-use rate windows. If your utility uses time-of-use pricing, note peak and off-peak hours to optimize battery charge and discharge scheduling.
- Run a REopt analysis. According to NREL’s REopt User Manual, modeling tools like REopt help determine system sizing and dispatch strategy against life-cycle cost and critical-load coverage during outages. This is the most rigorous free tool available for residential solar-plus-storage modeling.
- Review results with your installer. Use the model outputs to have an informed conversation about battery size, inverter capacity, and backup panel configuration.
Pro Tip: Include both typical short outages and multi-day scenarios in your model. A system sized for a four-hour outage may not support critical loads through a 72-hour storm event. The cost difference between the two configurations is often smaller than homeowners expect when you factor in the peace of mind and avoided losses.
For homeowners looking to fully maximize solar output and plan beyond standard annual savings, resilience modeling is the step that separates a good installation from a genuinely valuable one.
The biggest solar optimization mistake most homeowners make
After more than two decades working with Washington and Oregon homeowners, the pattern is clear: the most common mistake is fixating on panel count rather than whole-system efficiency.
It is easy to compare quotes by the number of panels or total kilowatts. More panels feels like more value. But a 10-kilowatt system with poor shading mitigation, a low-quality string inverter, and no monitoring can easily underperform a well-designed 7-kilowatt system with microinverters, panel-level monitoring, and a home that has already completed basic efficiency upgrades.
The overlooked impact of simple improvements is significant. Air sealing and attic insulation alone can reduce annual heating and cooling loads by 15 to 20 percent in older Pacific Northwest homes. That reduction translates directly into fewer panels needed, a smaller system cost, and a faster payback period. Yet most homeowners are so focused on the solar quote that they skip these conversations entirely.
Realistic energy modeling is equally underused. Asking your installer for a month-by-month production estimate, matched against your actual utility bills by month, reveals whether a proposed system genuinely covers your usage or just looks good on an annualized basis. Annualized numbers often mask winter shortfalls that send your bill higher than expected from November through February.
Smart consumers ask the right questions and look beyond upfront cost and incentives. Oregon and Washington rebates matter. But a well-designed, correctly sized system built by a qualified contractor with strong warranties will deliver more lifetime value than a cheaper system that underperforms for 25 years. Focusing on the whole picture, not just the sticker price, is the mindset that makes advanced solar optimization actually work in real Pacific Northwest conditions.
Ready to optimize your home solar system?
To put these strategies into action and unlock lasting performance, expert help can make all the difference.
A&R Solar brings two decades of regional experience to every residential project, from initial assessment through system monitoring and long-term support. Browse real residential projects to see how Pacific Northwest homeowners have improved performance and cut energy costs with systems designed for actual local conditions.
Whether you need a new installation, a performance review of an existing system, or ongoing support, the team at A&R Solar is ready. Explore solar repair and service for diagnostics and maintenance, or start with the solar maintenance checklist to identify quick wins for your current system. Reach out today to schedule a consultation and get a clear plan for better performance and lasting savings.
Frequently asked questions
What should I do before upgrading my home solar system?
Check the condition of your roof, assess shading from nearby trees or structures, and complete home efficiency upgrades before expanding your system. As Energy Trust of Oregon advises, reducing your home’s energy demand can shrink the required solar system size and lower your overall project cost.
How do utility billing policies affect solar cost savings in Oregon?
Because net metering credits vary from retail rates down to avoided-cost rates as low as 4 cents per kilowatt-hour, sizing your system to maximize self-consumption is critical to achieving the best financial return under Oregon’s billing rules.
How can I improve my system’s performance in a shady or cloudy area?
Choose microinverters or power optimizers to maintain panel-level independence, and monitor performance monthly to catch underperforming panels early. Microinverters and optimizers are specifically recommended for the Pacific Northwest because partial shading is common and individual panel monitoring aids diagnostics.
What’s the best way to pick a reliable solar installer?
Compare at least three detailed bids side by side, verify licenses, and check references from completed projects in your region. Energy Trust of Oregon recommends avoiding contractors who use aggressive sales tactics or present contracts with unclear terms, as these practices often signal long-term performance and cost risks.