

TL;DR:
- Solar panel efficiency measures how effectively panels convert sunlight into electricity, but lab ratings often overestimate real-world performance. Factors like temperature, shading, soiling, and system losses cause actual output to be 75-85% of rated capacity, especially in the Pacific Northwest’s climate. Proper installation, site assessment, and system design are crucial to maximize real-world energy production beyond just the efficiency percentage.
Solar panel efficiency is one of the most cited numbers in any solar conversation, and one of the most misunderstood. It measures how much sunlight converts into usable electricity, expressed as a percentage. A panel rated at 20% efficiency converts 20% of the solar energy hitting its surface into power for your home. Simple enough. But homeowners in Washington and Oregon often make purchasing decisions based on that single number without knowing it was measured in a lab under conditions that almost never exist outdoors. Understanding what efficiency really means, and what it doesn’t, is the difference between a system that meets expectations and one that disappoints.
Table of Contents
- What is solar panel efficiency and how is it measured?
- Why real-world solar panel efficiency differs from lab ratings
- Types of solar panels and how efficiency varies
- How to optimize solar panel efficiency for your home in Washington and Oregon
- Balancing efficiency with cost and system performance
- Rethinking solar panel efficiency: what Pacific Northwest homeowners often overlook
- Ready to maximize your home’s solar efficiency with expert help?
- Frequently asked questions
What is solar panel efficiency and how is it measured?
Solar panel efficiency tells you how effectively a panel turns sunlight into electricity. According to the U.S. Department of Energy, it is the percentage of incident solar energy a photovoltaic (PV) cell or module converts into usable power. A higher percentage means more electricity from the same amount of sunlight hitting the same surface area.
The number on a panel’s spec sheet comes from a standardized test called Standard Test Conditions, or STC. This test uses a fixed cell temperature of 25°C, a solar irradiance of 1,000 watts per square meter, and an air mass spectrum labeled AM 1.5, which represents a clear midday sun at a moderate latitude. Every manufacturer tests under STC so buyers can compare panels on equal footing.
The formula behind the rating is straightforward:
- Measure the panel’s maximum power output (in watts) under STC.
- Divide that output by the total surface area of the panel (in square meters).
- Divide again by the 1,000 W/m² irradiance used in the test.
- Multiply by 100 to get the percentage.
A few important distinctions worth knowing:
- Cell efficiency vs. module efficiency: Individual solar cells test at higher efficiencies than the assembled panel. Wiring connections, the frame, and the protective glass all reduce the overall module figure.
- Rated vs. real-world output: STC is a snapshot. It tells you the ceiling, not the everyday average.
- Surface area matters: Two panels with the same wattage but different physical sizes will have different efficiency ratings. Smaller panel, same watts, higher efficiency.
Understanding how solar panel manufacturing energy factors into overall system value puts efficiency ratings in broader context. Efficiency is a useful comparison tool, but it is one data point, not the final verdict on a panel’s worth for your home.
Why real-world solar panel efficiency differs from lab ratings
Lab numbers are clean. Real rooftops are not. Once your panels are installed, they face conditions that STC never accounts for, and the performance gap can be significant.
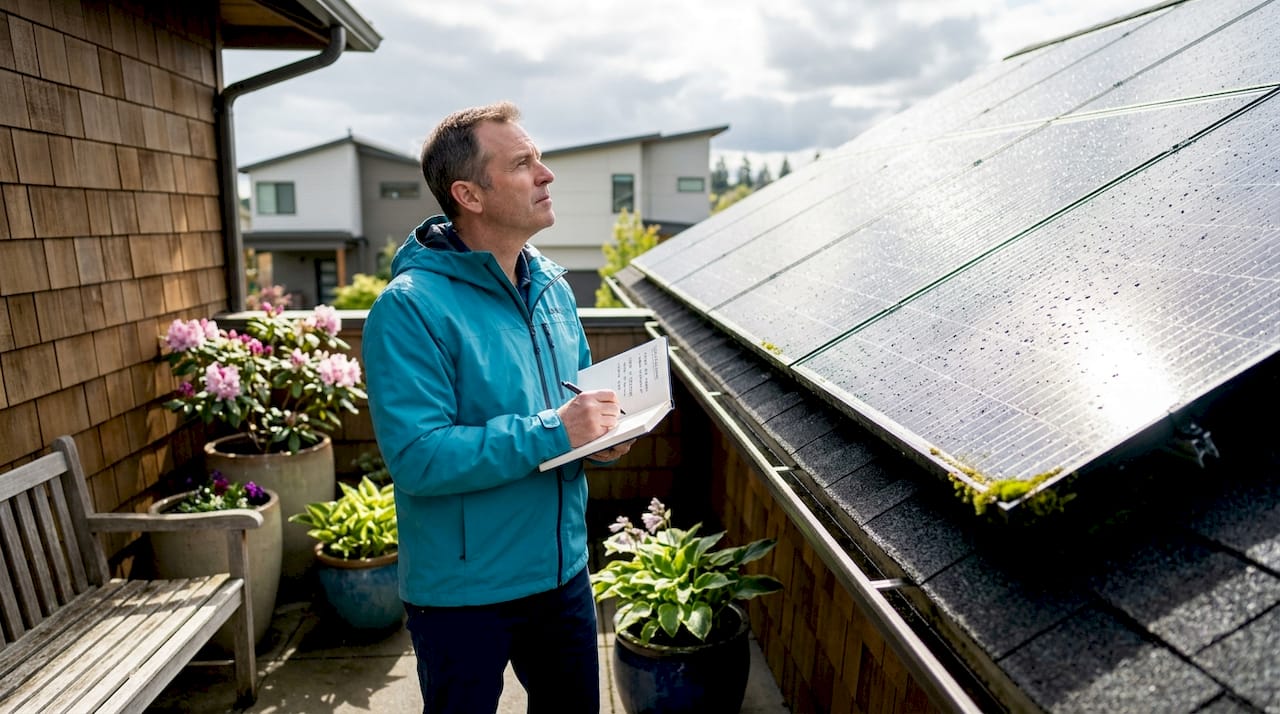
Temperature is the biggest culprit. Higher temperatures reduce PV performance because hotter cells see a larger voltage drop than any current gain can offset. The net result is lower efficiency and, over time, shortened panel lifespan. On a hot summer afternoon in the Willamette Valley, a rooftop panel can easily reach 50°C or higher, well above the 25°C STC baseline.
Other real-world losses stack up quickly:
- Shading: A single shaded cell can drag down output for an entire string of panels, not just the shaded one.
- Soiling: Dust, pollen, bird droppings, and moss (particularly common in the Pacific Northwest) reduce the light reaching cells.
- Wiring resistance: DC power traveling from the panels to the inverter loses a small percentage in the wires.
- Inverter conversion losses: Converting DC to AC power introduces additional efficiency reduction.
- Panel degradation: Panels lose roughly 0.5% output per year on average as materials age.
Real-world output context: Rated efficiency is a laboratory figure. Real-world energy yield is typically lower because conditions such as temperature, irradiance, and system losses all differ from STC. Most homeowners should plan on receiving about 75 to 85% of the panel’s rated output under typical conditions.
Pro Tip: In the Pacific Northwest, panels rarely overheat the way they do in desert climates, but soiling from moss and organic debris is a bigger issue. Budgeting for an annual rinse can recover 3 to 5% of lost output in wetter climates like western Oregon and Washington.
Understanding the factors that influence solar energy production specific to your location helps set accurate expectations before you commit to a system size.
Types of solar panels and how efficiency varies
Not all solar panels are built the same way, and the technology inside determines how efficiently they convert light. Most commercial solar panels currently rate between 17% and 20% efficiency, while laboratory researchers have pushed individual cell efficiencies close to 50% under highly controlled conditions. That gap between the lab and the commercial market reflects manufacturing costs, durability trade-offs, and real-world packaging realities.
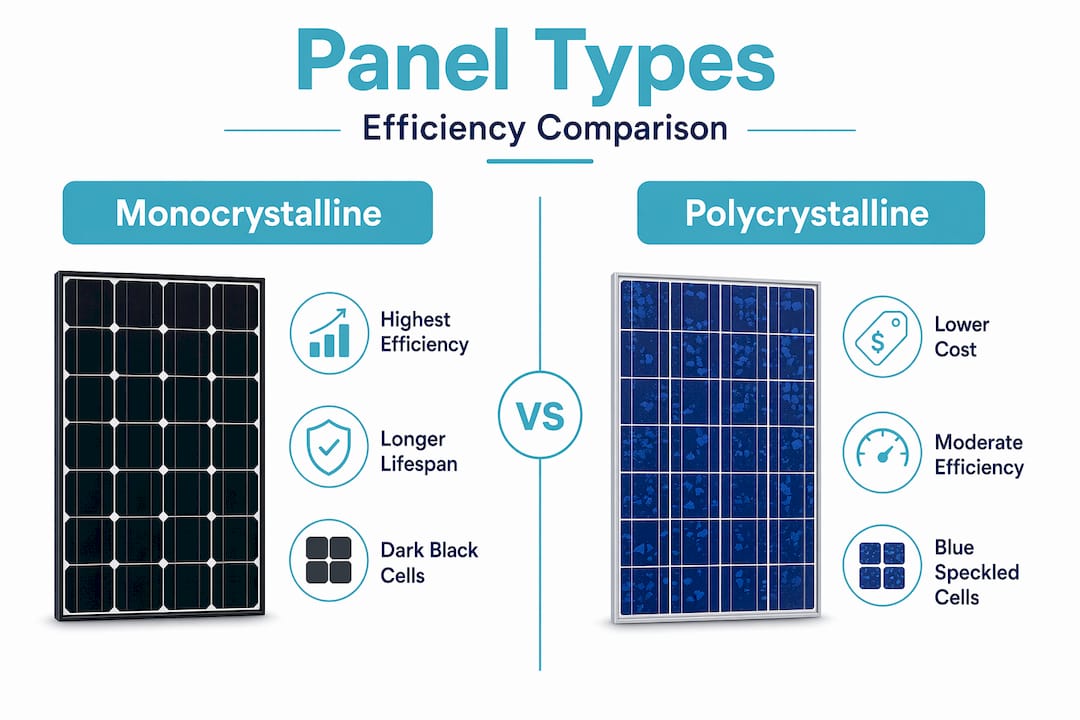
Here is how the three main panel types compare for residential use:
| Panel type | Typical efficiency | Cost relative | Best suited for |
|---|---|---|---|
| Monocrystalline | 20–22% | Higher | Limited roof space |
| Polycrystalline | 15–18% | Mid-range | Larger roof areas |
| Thin-film | 10–18% | Varies | Specialty applications |
Key considerations beyond the efficiency number:
- Monocrystalline panels use a single continuous silicon crystal structure, which allows electrons to move more freely and converts more light per square foot. They are the right choice when roof space is tight, which is common in older Pacific Northwest neighborhoods.
- Polycrystalline panels use fragmented silicon crystals, slightly limiting electron movement. They cost less per panel but require more panels to reach the same output, which can offset the savings through additional installation costs.
- Thin-film panels apply photovoltaic material to a surface in thin layers. They handle partial shading and diffuse light reasonably well, but their lower efficiency means they need significantly more space.
Pro Tip: Efficiency tells you watts per square foot. If your roof has 400 square feet of viable south-facing space, a 22% efficient monocrystalline panel produces notably more total power than a 16% polycrystalline panel in that same footprint.
Learning what happens to energy in a solar PV system from panel to outlet helps clarify why panel type and system design work together.
How to optimize solar panel efficiency for your home in Washington and Oregon
Choosing the right panel is only half the job. How and where you install it determines how close you get to that rated efficiency in practice. Pacific Northwest homeowners can improve real-world solar output significantly through thermal conditions and panel placement decisions made at the design stage.
Follow these steps to get the most from your system:
- Match tilt to local latitude. Western Oregon and Washington fall between roughly 44° and 49° latitude. Setting panels at a tilt angle close to your latitude maximizes annual solar collection.
- Face panels true south. Magnetic south is not the same as true south. A professional installer accounts for local magnetic declination when setting panel orientation.
- Eliminate shading wherever possible. Trees that seem distant in winter can shade panels in summer when the sun is higher. A shade analysis before installation prevents years of underperformance.
- Choose racking that allows airflow underneath. A gap between the roof surface and the back of the panel allows heat to dissipate, keeping cell temperatures closer to STC conditions.
- Schedule regular cleaning. Western Washington and Oregon receive substantial rainfall, which helps, but moss and organic material can still accumulate. A soft-rinse cleaning each spring makes a measurable difference.
- Prioritize reputable warranties. A 25-year linear performance warranty from a bankable manufacturer provides assurance that the panel’s efficiency degradation stays within predictable limits.
Efficiency improvements depend on variables including temperature, irradiance, mounting, and shading, and getting those variables right at installation is far easier than correcting them later.
Pro Tip: Ask your installer to provide a shade analysis report before signing a contract. Even 10% shading on one panel can reduce total system output by more than you’d expect depending on how your panels are wired.
Your installer’s approach to panel placement and system design directly determines how close your actual output comes to the system’s rated potential.
Balancing efficiency with cost and system performance
A 22% efficient panel sounds better than a 17% panel. But cost per watt is often a more relevant metric than efficiency percentage alone when sizing a residential solar investment.
Here is the practical trade-off:
| Factor | High efficiency panel | Lower efficiency panel |
|---|---|---|
| Upfront cost per watt | Higher | Lower |
| Roof space required | Less | More |
| Total panel count for same output | Fewer | More |
| Installation complexity | Lower | Potentially higher |
| 25-year energy output | Similar | Similar (with correct sizing) |
Other financial and performance factors that matter alongside efficiency:
- Degradation rate: Panels lose output gradually over time. A panel with a lower degradation rate (0.3% annually vs. 0.7%) produces meaningfully more energy over 25 years, regardless of initial efficiency rating.
- Inverter compatibility: A high-efficiency panel paired with an undersized or older string inverter will not deliver its potential. System design matters as much as panel specs.
- Local electricity rates: The higher your utility rate, the more financial value each kilowatt-hour your panels produce. Washington and Oregon rates have been rising, which strengthens the case for a well-sized system over a marginally more efficient one.
- Available roof space: If your roof can accommodate a larger array, lower-cost panels may deliver the same lifetime savings at a lower total investment.
Evaluating why solar makes financial sense for homes in the Pacific Northwest requires looking at the full picture, not just the efficiency percentage on the box.
Rethinking solar panel efficiency: what Pacific Northwest homeowners often overlook
After two decades of residential solar work in Washington and Oregon, one pattern stands out. Homeowners who spend the most time researching efficiency ratings often end up with systems that underperform relative to expectations. Not because they chose bad panels, but because they optimized for the wrong variable.
A 2% difference in panel efficiency matters far less than the quality of your roof assessment, the precision of your shade analysis, or whether your installer properly ventilates the racking system. Temperature is a primary performance lever, and in the Pacific Northwest, where summers are increasingly warm, thermal management during installation decisions has a compounding effect on output year after year.
There is also a less-discussed reality about solar physics: most incident light isn’t converted to electricity. Losses from reflection, heat, and semiconductor behavior dominate before a single watt reaches your inverter. The difference between a 19% panel and a 21% panel is real, but it is small compared to the losses introduced by poor installation or an unaddressed shading issue.
The Pacific Northwest climate adds another layer. Overcast skies in winter mean lower irradiance, which actually reduces temperature-related losses. Your panels may perform closer to their rated efficiency on a cool, partly cloudy November day than on a blazing July afternoon. That nuance rarely appears in efficiency rating conversations.
Our recommendation: focus your evaluation on total annual kilowatt-hours produced rather than peak efficiency percentages. Ask your installer to provide an annual production estimate based on your specific roof, location, and shading conditions. That number is what pays your electricity bill. Reviewing real solar output insights for homes similar to yours gives a clearer picture than any spec sheet comparison.
Ready to maximize your home’s solar efficiency with expert help?
Understanding solar panel efficiency is valuable. Applying it correctly to your specific home, roof, and energy goals is where the real savings happen.

A&R Solar has spent nearly two decades designing and installing residential solar systems across Washington and Oregon, with a focus on real-world performance rather than spec sheet numbers. Our team conducts detailed site assessments, shade analyses, and thermal management planning before a single panel goes up. Browse our residential solar case studies to see how Pacific Northwest homeowners are generating measurable savings, or explore our residential solar projects for examples of system designs tailored to homes like yours. When you’re ready to move from research to action, contact A&R Solar to schedule a consultation and get a production estimate based on your actual roof.
Frequently asked questions
What does solar panel efficiency percentage mean?
Solar panel efficiency is the percentage of sunlight a panel converts into usable electricity under standardized lab conditions. A 20% efficient panel turns 20% of the solar energy hitting its surface into power.
Why is the real energy output often lower than the panel’s efficiency rating?
Actual output is lower because real-world conditions including higher temperatures, shading, soiling, and wiring losses all differ from the idealized conditions used to assign the rated efficiency. Most homeowners see 75 to 85% of rated capacity under typical operating conditions.
Are higher efficiency panels always the best choice for my home?
Not necessarily. Cost per watt is often a more practical metric than efficiency alone, and lower-efficiency panels on a larger available roof area can deliver the same annual energy output at a lower total cost.
How does temperature affect my solar panels’ efficiency in the Pacific Northwest?
Higher cell temperatures reduce voltage more than they increase current, which lowers overall efficiency. Proper panel ventilation and strategic placement help keep cell temperatures lower and performance higher, especially during warm Pacific Northwest summers.
Recommended
- Solar Panel Maintenance for PNW Homeowners: A Practical Checklist
- Solar terminology guide for WA and OR homeowners
- Solar panels at home: savings, benefits, and energy security
TL;DR:
- Solar panel efficiency measures how effectively panels convert sunlight into electricity, but lab ratings often overestimate real-world performance. Factors like temperature, shading, soiling, and system losses cause actual output to be 75-85% of rated capacity, especially in the Pacific Northwest’s climate. Proper installation, site assessment, and system design are crucial to maximize real-world energy production beyond just the efficiency percentage.
Solar panel efficiency is one of the most cited numbers in any solar conversation, and one of the most misunderstood. It measures how much sunlight converts into usable electricity, expressed as a percentage. A panel rated at 20% efficiency converts 20% of the solar energy hitting its surface into power for your home. Simple enough. But homeowners in Washington and Oregon often make purchasing decisions based on that single number without knowing it was measured in a lab under conditions that almost never exist outdoors. Understanding what efficiency really means, and what it doesn’t, is the difference between a system that meets expectations and one that disappoints.
Table of Contents
- What is solar panel efficiency and how is it measured?
- Why real-world solar panel efficiency differs from lab ratings
- Types of solar panels and how efficiency varies
- How to optimize solar panel efficiency for your home in Washington and Oregon
- Balancing efficiency with cost and system performance
- Rethinking solar panel efficiency: what Pacific Northwest homeowners often overlook
- Ready to maximize your home’s solar efficiency with expert help?
- Frequently asked questions
What is solar panel efficiency and how is it measured?
Solar panel efficiency tells you how effectively a panel turns sunlight into electricity. According to the U.S. Department of Energy, it is the percentage of incident solar energy a photovoltaic (PV) cell or module converts into usable power. A higher percentage means more electricity from the same amount of sunlight hitting the same surface area.
The number on a panel’s spec sheet comes from a standardized test called Standard Test Conditions, or STC. This test uses a fixed cell temperature of 25°C, a solar irradiance of 1,000 watts per square meter, and an air mass spectrum labeled AM 1.5, which represents a clear midday sun at a moderate latitude. Every manufacturer tests under STC so buyers can compare panels on equal footing.
The formula behind the rating is straightforward:
- Measure the panel’s maximum power output (in watts) under STC.
- Divide that output by the total surface area of the panel (in square meters).
- Divide again by the 1,000 W/m² irradiance used in the test.
- Multiply by 100 to get the percentage.
A few important distinctions worth knowing:
- Cell efficiency vs. module efficiency: Individual solar cells test at higher efficiencies than the assembled panel. Wiring connections, the frame, and the protective glass all reduce the overall module figure.
- Rated vs. real-world output: STC is a snapshot. It tells you the ceiling, not the everyday average.
- Surface area matters: Two panels with the same wattage but different physical sizes will have different efficiency ratings. Smaller panel, same watts, higher efficiency.
Understanding how solar panel manufacturing energy factors into overall system value puts efficiency ratings in broader context. Efficiency is a useful comparison tool, but it is one data point, not the final verdict on a panel’s worth for your home.
Why real-world solar panel efficiency differs from lab ratings
Lab numbers are clean. Real rooftops are not. Once your panels are installed, they face conditions that STC never accounts for, and the performance gap can be significant.
Temperature is the biggest culprit. Higher temperatures reduce PV performance because hotter cells see a larger voltage drop than any current gain can offset. The net result is lower efficiency and, over time, shortened panel lifespan. On a hot summer afternoon in the Willamette Valley, a rooftop panel can easily reach 50°C or higher, well above the 25°C STC baseline.
Other real-world losses stack up quickly:
- Shading: A single shaded cell can drag down output for an entire string of panels, not just the shaded one.
- Soiling: Dust, pollen, bird droppings, and moss (particularly common in the Pacific Northwest) reduce the light reaching cells.
- Wiring resistance: DC power traveling from the panels to the inverter loses a small percentage in the wires.
- Inverter conversion losses: Converting DC to AC power introduces additional efficiency reduction.
- Panel degradation: Panels lose roughly 0.5% output per year on average as materials age.
Real-world output context: Rated efficiency is a laboratory figure. Real-world energy yield is typically lower because conditions such as temperature, irradiance, and system losses all differ from STC. Most homeowners should plan on receiving about 75 to 85% of the panel’s rated output under typical conditions.
Pro Tip: In the Pacific Northwest, panels rarely overheat the way they do in desert climates, but soiling from moss and organic debris is a bigger issue. Budgeting for an annual rinse can recover 3 to 5% of lost output in wetter climates like western Oregon and Washington.
Understanding the factors that influence solar energy production specific to your location helps set accurate expectations before you commit to a system size.
Types of solar panels and how efficiency varies
Not all solar panels are built the same way, and the technology inside determines how efficiently they convert light. Most commercial solar panels currently rate between 17% and 20% efficiency, while laboratory researchers have pushed individual cell efficiencies close to 50% under highly controlled conditions. That gap between the lab and the commercial market reflects manufacturing costs, durability trade-offs, and real-world packaging realities.
Here is how the three main panel types compare for residential use:
| Panel type | Typical efficiency | Cost relative | Best suited for |
|---|---|---|---|
| Monocrystalline | 20–22% | Higher | Limited roof space |
| Polycrystalline | 15–18% | Mid-range | Larger roof areas |
| Thin-film | 10–18% | Varies | Specialty applications |
Key considerations beyond the efficiency number:
- Monocrystalline panels use a single continuous silicon crystal structure, which allows electrons to move more freely and converts more light per square foot. They are the right choice when roof space is tight, which is common in older Pacific Northwest neighborhoods.
- Polycrystalline panels use fragmented silicon crystals, slightly limiting electron movement. They cost less per panel but require more panels to reach the same output, which can offset the savings through additional installation costs.
- Thin-film panels apply photovoltaic material to a surface in thin layers. They handle partial shading and diffuse light reasonably well, but their lower efficiency means they need significantly more space.
Pro Tip: Efficiency tells you watts per square foot. If your roof has 400 square feet of viable south-facing space, a 22% efficient monocrystalline panel produces notably more total power than a 16% polycrystalline panel in that same footprint.
Learning what happens to energy in a solar PV system from panel to outlet helps clarify why panel type and system design work together.
How to optimize solar panel efficiency for your home in Washington and Oregon
Choosing the right panel is only half the job. How and where you install it determines how close you get to that rated efficiency in practice. Pacific Northwest homeowners can improve real-world solar output significantly through thermal conditions and panel placement decisions made at the design stage.
Follow these steps to get the most from your system:
- Match tilt to local latitude. Western Oregon and Washington fall between roughly 44° and 49° latitude. Setting panels at a tilt angle close to your latitude maximizes annual solar collection.
- Face panels true south. Magnetic south is not the same as true south. A professional installer accounts for local magnetic declination when setting panel orientation.
- Eliminate shading wherever possible. Trees that seem distant in winter can shade panels in summer when the sun is higher. A shade analysis before installation prevents years of underperformance.
- Choose racking that allows airflow underneath. A gap between the roof surface and the back of the panel allows heat to dissipate, keeping cell temperatures closer to STC conditions.
- Schedule regular cleaning. Western Washington and Oregon receive substantial rainfall, which helps, but moss and organic material can still accumulate. A soft-rinse cleaning each spring makes a measurable difference.
- Prioritize reputable warranties. A 25-year linear performance warranty from a bankable manufacturer provides assurance that the panel’s efficiency degradation stays within predictable limits.
Efficiency improvements depend on variables including temperature, irradiance, mounting, and shading, and getting those variables right at installation is far easier than correcting them later.
Pro Tip: Ask your installer to provide a shade analysis report before signing a contract. Even 10% shading on one panel can reduce total system output by more than you’d expect depending on how your panels are wired.
Your installer’s approach to panel placement and system design directly determines how close your actual output comes to the system’s rated potential.
Balancing efficiency with cost and system performance
A 22% efficient panel sounds better than a 17% panel. But cost per watt is often a more relevant metric than efficiency percentage alone when sizing a residential solar investment.
Here is the practical trade-off:
| Factor | High efficiency panel | Lower efficiency panel |
|---|---|---|
| Upfront cost per watt | Higher | Lower |
| Roof space required | Less | More |
| Total panel count for same output | Fewer | More |
| Installation complexity | Lower | Potentially higher |
| 25-year energy output | Similar | Similar (with correct sizing) |
Other financial and performance factors that matter alongside efficiency:
- Degradation rate: Panels lose output gradually over time. A panel with a lower degradation rate (0.3% annually vs. 0.7%) produces meaningfully more energy over 25 years, regardless of initial efficiency rating.
- Inverter compatibility: A high-efficiency panel paired with an undersized or older string inverter will not deliver its potential. System design matters as much as panel specs.
- Local electricity rates: The higher your utility rate, the more financial value each kilowatt-hour your panels produce. Washington and Oregon rates have been rising, which strengthens the case for a well-sized system over a marginally more efficient one.
- Available roof space: If your roof can accommodate a larger array, lower-cost panels may deliver the same lifetime savings at a lower total investment.
Evaluating why solar makes financial sense for homes in the Pacific Northwest requires looking at the full picture, not just the efficiency percentage on the box.
Rethinking solar panel efficiency: what Pacific Northwest homeowners often overlook
After two decades of residential solar work in Washington and Oregon, one pattern stands out. Homeowners who spend the most time researching efficiency ratings often end up with systems that underperform relative to expectations. Not because they chose bad panels, but because they optimized for the wrong variable.
A 2% difference in panel efficiency matters far less than the quality of your roof assessment, the precision of your shade analysis, or whether your installer properly ventilates the racking system. Temperature is a primary performance lever, and in the Pacific Northwest, where summers are increasingly warm, thermal management during installation decisions has a compounding effect on output year after year.
There is also a less-discussed reality about solar physics: most incident light isn’t converted to electricity. Losses from reflection, heat, and semiconductor behavior dominate before a single watt reaches your inverter. The difference between a 19% panel and a 21% panel is real, but it is small compared to the losses introduced by poor installation or an unaddressed shading issue.
The Pacific Northwest climate adds another layer. Overcast skies in winter mean lower irradiance, which actually reduces temperature-related losses. Your panels may perform closer to their rated efficiency on a cool, partly cloudy November day than on a blazing July afternoon. That nuance rarely appears in efficiency rating conversations.
Our recommendation: focus your evaluation on total annual kilowatt-hours produced rather than peak efficiency percentages. Ask your installer to provide an annual production estimate based on your specific roof, location, and shading conditions. That number is what pays your electricity bill. Reviewing real solar output insights for homes similar to yours gives a clearer picture than any spec sheet comparison.
Ready to maximize your home’s solar efficiency with expert help?
Understanding solar panel efficiency is valuable. Applying it correctly to your specific home, roof, and energy goals is where the real savings happen.
A&R Solar has spent nearly two decades designing and installing residential solar systems across Washington and Oregon, with a focus on real-world performance rather than spec sheet numbers. Our team conducts detailed site assessments, shade analyses, and thermal management planning before a single panel goes up. Browse our residential solar case studies to see how Pacific Northwest homeowners are generating measurable savings, or explore our residential solar projects for examples of system designs tailored to homes like yours. When you’re ready to move from research to action, contact A&R Solar to schedule a consultation and get a production estimate based on your actual roof.
Frequently asked questions
What does solar panel efficiency percentage mean?
Solar panel efficiency is the percentage of sunlight a panel converts into usable electricity under standardized lab conditions. A 20% efficient panel turns 20% of the solar energy hitting its surface into power.
Why is the real energy output often lower than the panel’s efficiency rating?
Actual output is lower because real-world conditions including higher temperatures, shading, soiling, and wiring losses all differ from the idealized conditions used to assign the rated efficiency. Most homeowners see 75 to 85% of rated capacity under typical operating conditions.
Are higher efficiency panels always the best choice for my home?
Not necessarily. Cost per watt is often a more practical metric than efficiency alone, and lower-efficiency panels on a larger available roof area can deliver the same annual energy output at a lower total cost.
How does temperature affect my solar panels’ efficiency in the Pacific Northwest?
Higher cell temperatures reduce voltage more than they increase current, which lowers overall efficiency. Proper panel ventilation and strategic placement help keep cell temperatures lower and performance higher, especially during warm Pacific Northwest summers.