TL;DR:
- The true cost of residential solar in Washington and Oregon ranges from $14,500 to $21,000 before incentives.
- Soft costs, including permits and labor, account for about 40% of the total system price.
- Long-term savings typically total $25,000 to $30,000 over 25 years, with payback periods of 8 to 13 years.
The sticker price of solar stops a lot of homeowners cold. You see a quote for $18,000 and close the tab. But that number before incentives, tax exemptions, and utility savings tells only part of the story. In Washington and Oregon, the real out-of-pocket cost is often thousands lower, and the financial return stretches over decades. This guide breaks down exactly what you pay for, what you get back, and what a realistic 25-year savings picture looks like for Pacific Northwest homeowners in 2026.
Table of Contents
- What makes up the cost of a residential solar system?
- How much does solar really cost in Washington and Oregon?
- Solar incentives in Washington and Oregon: What reduces your cost?
- Annual savings and long-term ROI: What can you really expect?
- What most homeowners miss about solar energy costs
- See how you can save with solar in Washington or Oregon
- Frequently asked questions
Key Takeaways
| Point | Details |
|---|---|
| True cost breakdown | Panels, labor, and soft costs each represent a major portion of your final bill. |
| Regional pricing insights | Washington and Oregon system costs are competitive with national averages but vary with system size. |
| Substantial incentives | State and utility incentives in the Northwest can reduce solar costs by thousands. |
| Realistic ROI timeline | Expect payback in 8–13 years and 25-year lifetime savings exceeding $25,000 for most homes. |
What makes up the cost of a residential solar system?
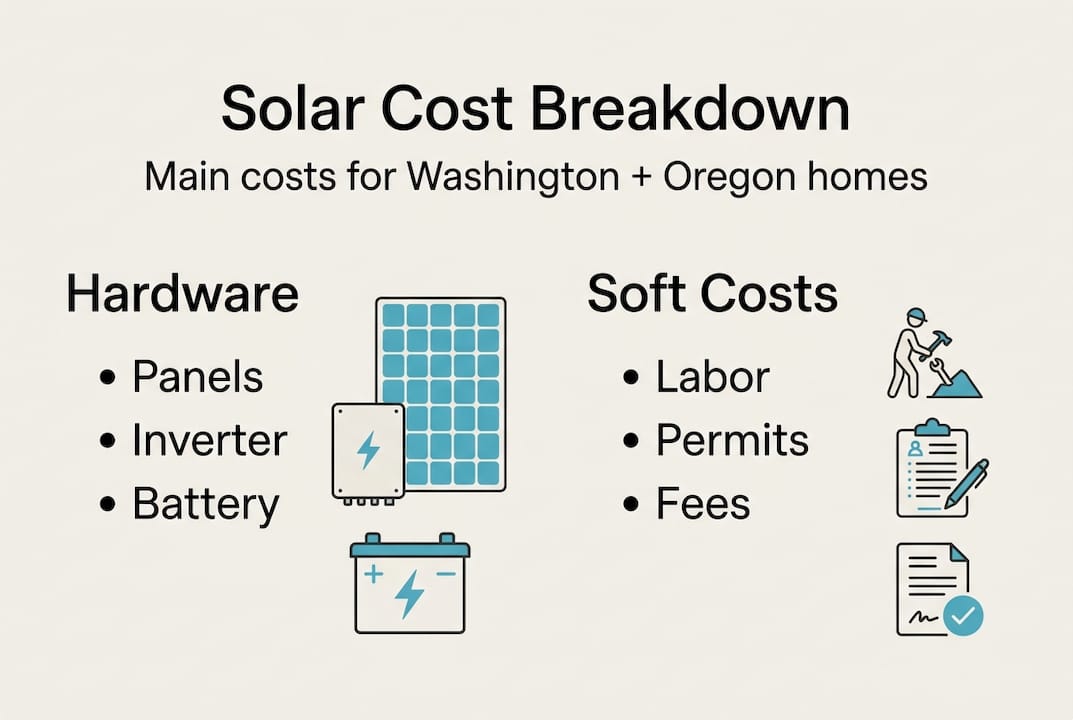
Most people assume solar costs are mostly about the panels themselves. The reality is more layered. A typical 5 kW residential installation in Washington is made up of hardware and what the industry calls soft costs, and each category carries more weight than most homeowners expect.
According to cost breakdown data, hardware accounts for roughly 60% of the total installed price, while soft costs make up the remaining 40%. Here is how that breaks down for a typical system:
| Cost component | % of total cost | Estimated range (5 kW) |
|---|---|---|
| Solar panels | 40-43% | $5,800-$9,000 |
| Inverters | 7-9% | $1,000-$1,900 |
| Racking and wiring | 8-10% | $1,200-$2,100 |
| Labor | 17-19% | $2,500-$4,000 |
| Permitting | 3-4% | $435-$840 |
| Overhead and margin | 8-10% | $1,200-$2,100 |
Panels are the single largest line item, but labor, permitting, and overhead together represent a substantial share of the total. This is important because solar panels for your home are only as effective as the installation and support surrounding them.
Soft costs often surprise homeowners. They include:
- Permit applications and inspections
- Utility interconnection fees
- System design and engineering
- Installer overhead and warranty coverage
- Sales and project management
These aren’t padding. Permits and interconnection ensure your system is grid-legal and qualifies for net metering credits. Engineering ensures your roof and electrical panel can support the load. Skimping on installer quality to save on soft costs often leads to problems that cost more to fix later.
One important pricing dynamic: larger systems generally cost less per watt. A 7 kW system will typically have a lower cost per watt than a 5 kW system, because many of the fixed soft costs stay roughly the same regardless of system size. If your energy use justifies it, sizing up can improve your overall value. You can also review the US solar cost breakdown for national context.
How much does solar really cost in Washington and Oregon?
Understanding each component is key, but what do these costs look like for an actual Northwest homeowner in 2026?
Average system costs in Washington for 2026 range from $14,500 to $21,000 before incentives for systems sized between 5 and 7 kW, or about $2.55 to $3.00 per watt. Oregon tracks closely with Washington, generally falling in a similar range.
For national comparison, the US average sits at $2.95 per watt for residential systems in 2026. Washington homeowners are at or slightly below the national average on a per-watt basis, which surprises many people who assume remote Pacific Northwest installations carry a premium.
| Washington | Oregon | US average | |
|---|---|---|---|
| Typical system size | 5-7 kW | 5-7 kW | 6 kW |
| Total price range | $14,500-$21,000 | $15,000-$21,500 | ~$17,700 |
| Cost per watt | $2.55-$3.00 | $2.60-$3.07 | $2.95 |
Several factors push your specific quote higher or lower:
- System size: Larger systems lower the cost per watt but raise the total price.
- Roof type and pitch: Complex roof structures require more labor and specialized racking.
- Installer reputation and warranties: Established installers often charge more but provide longer coverage.
- Battery storage: Adding a battery system increases the total cost significantly.
- Local permitting complexity: Some municipalities have lengthier, more expensive permit processes.
If you’re wondering whether solar is practical in the Northwest given our climate, the short answer is yes. Washington and Oregon receive enough annual sun hours to make residential solar financially viable for most homeowners.
Solar incentives in Washington and Oregon: What reduces your cost?
With the sticker price in mind, it’s time to figure out how much less you’ll actually pay after state and utility incentives.
The federal residential Investment Tax Credit (ITC) expired for new installations after 2025, which means 2026 buyers no longer have access to the 30% federal credit. This makes state and utility-level incentives more important than ever.
Washington incentives (2026)
Washington offers a sales tax exemption on solar equipment purchases. At the state rate of 6.5%, that saves roughly $950 to $1,365 on a typical system. Washington also maintains net metering at the full retail rate, meaning excess power your system sends to the grid is credited at the same rate you pay for electricity. Over time, this substantially improves your return. Washington solar incentives are worth reviewing in full before you buy.
Oregon incentives (2026)
Oregon homeowners benefit from several programs through the Energy Trust of Oregon. Key incentives include a $2,500 flat rebate for eligible homeowners, $0.90 per watt for low-income households (potentially $4,500 or more on a 5 kW system), a property tax exemption on added home value from solar, and rebates for battery storage. Review full details on Oregon solar incentives to confirm your eligibility.
Estimated upfront savings by state:
- Washington: $950-$1,365 from sales tax exemption, ongoing net metering credits
- Oregon: $2,500 rebate plus potential battery rebates and property tax savings
- Both states: Possible additional utility rebates through your local utility
Pro Tip: Check your specific utility’s website before finalizing any quote. Some utilities offer rebates beyond state programs, and these can change annually. Getting multiple installer quotes also helps you verify that incentives are being applied correctly.
Annual savings and long-term ROI: What can you really expect?
Subtracting incentives is one part. Now, let’s look at what you’ll save every year, and over the life of your system.
For a 7 kW system in Washington, typical annual savings run between $850 and $1,200 per year on electricity bills. Oregon homeowners see similar figures, often in the range of $70 to $200 per month depending on usage and utility rates. Over 25 years, that adds up to $25,000 to $30,000 in cumulative savings for a well-sized system.
A 7 kW Washington solar system typically pays for itself in 8 to 11 years and generates $25,000-$30,000 in savings over 25 years, even accounting for the Pacific Northwest’s cloudier climate.
Payback periods in Washington and Oregon are honest. Expect 8 to 13 years for most systems. That is longer than in Arizona or Southern California, where sun exposure is higher and electricity rates are lower. But Pacific Northwest utility rates have been rising steadily, and net metering policies in both states protect the value of your excess generation.
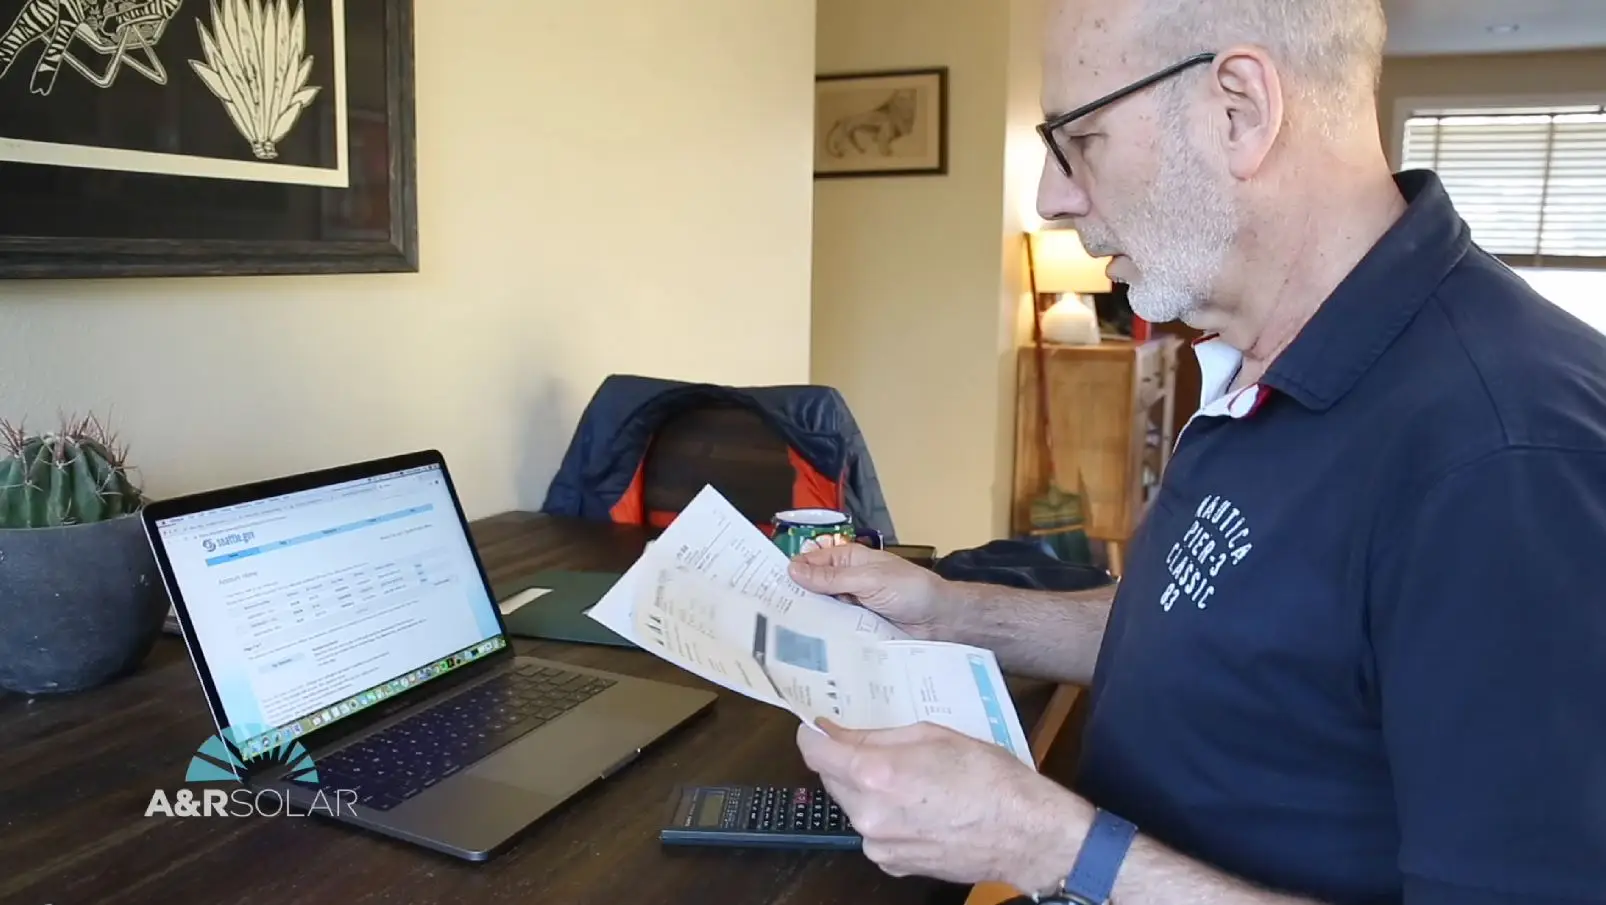
Here’s how to estimate your own ROI:
- Pull your last 12 months of electricity bills and calculate your average monthly usage in kilowatt-hours.
- Get at least three installer quotes that include a production estimate specific to your home and location.
- Apply all confirmed incentives to the gross system cost to arrive at your net cost.
- Divide net cost by annual savings to estimate your payback period.
- Multiply annual savings by 25 (typical system lifespan) for a rough lifetime value figure.
Pro Tip: Use a reputable solar calculator as a sanity check on installer estimates, but don’t rely on it as a final number. Local shading, roof orientation, and your actual utility tariff all affect real-world output.
What most homeowners miss about solar energy costs
After seeing hundreds of installations across Washington and Oregon, we’ve noticed a pattern. Homeowners spend most of their energy negotiating the upfront price, then overlook factors that affect far more of the long-term value.
The quality of your solar panel selection matters over a 25-year horizon far more than saving $500 upfront. A panel rated at 25-year performance from a manufacturer with a solid track record will out-earn a cheaper panel by a wide margin over that period. The same applies to inverter quality and workmanship warranties.
Soft costs frustrate homeowners because they feel abstract. But permit management, grid interconnection handling, and proper commissioning are what allow your system to actually function and earn net metering credits. A cheaper installation that skips corners on these steps can cost you credits, performance, and legal compliance.
Finally, batteries deserve a realistic look. They add meaningful cost, typically $1,000 to $1,400 per kWh of storage. But for homeowners with outage risk or time-of-use utility rates, the resilience and bill optimization they provide can justify that cost over time. Don’t dismiss them without running the actual numbers for your situation.

See how you can save with solar in Washington or Oregon
Ready to see how these numbers translate for your own home? Here’s how to take the next step.
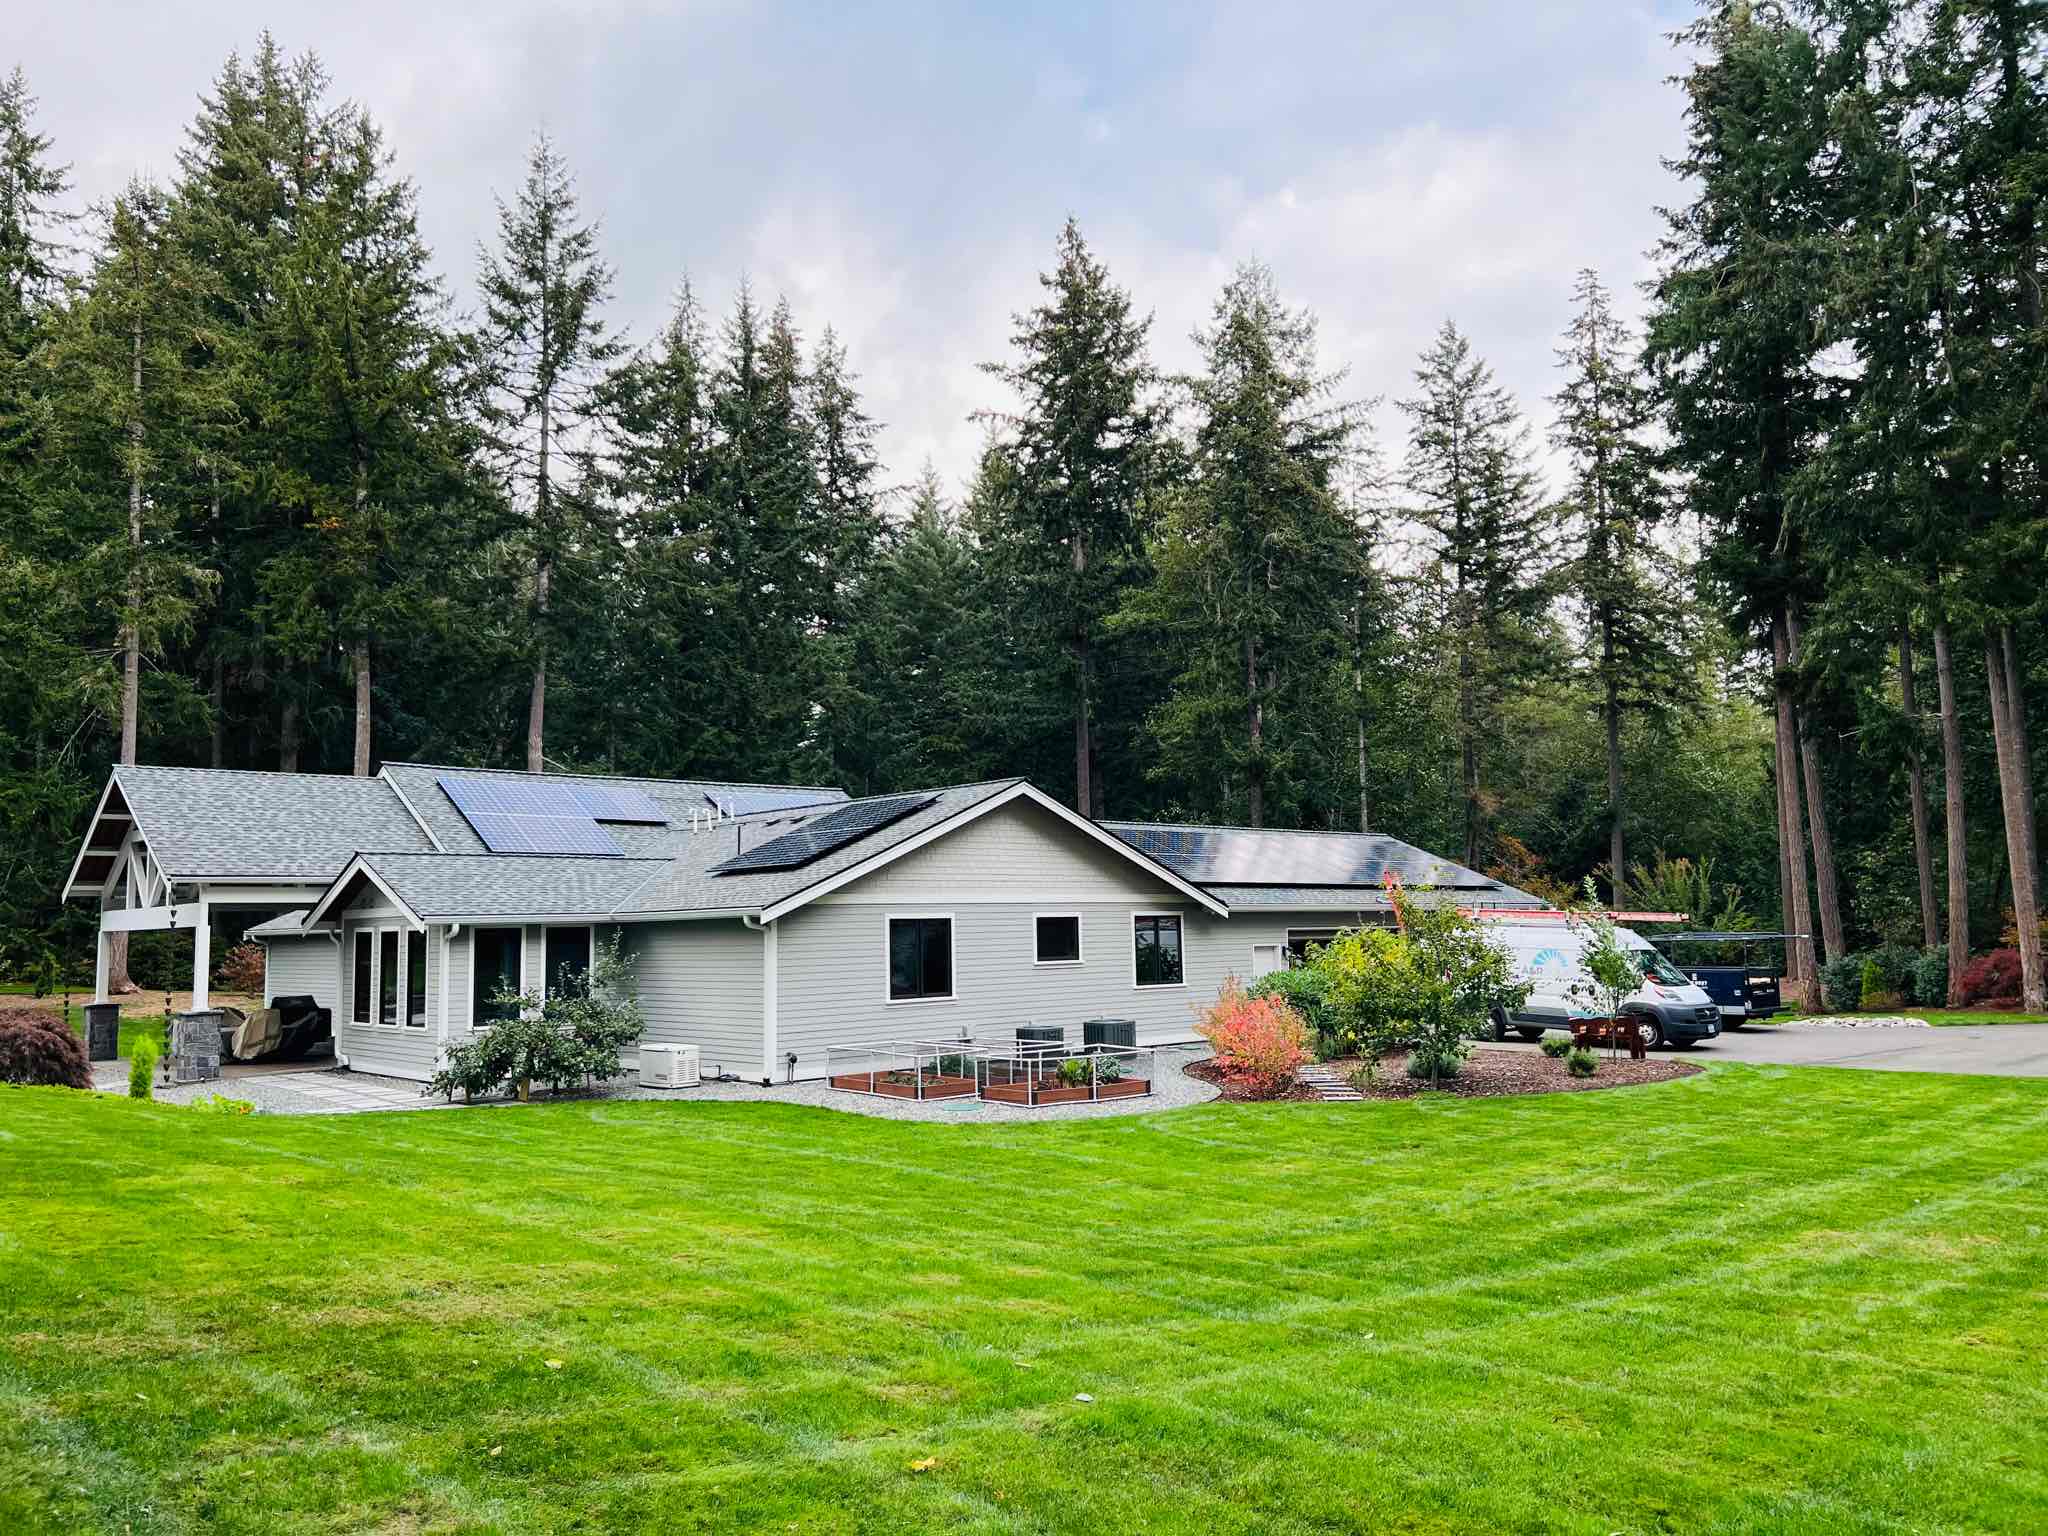
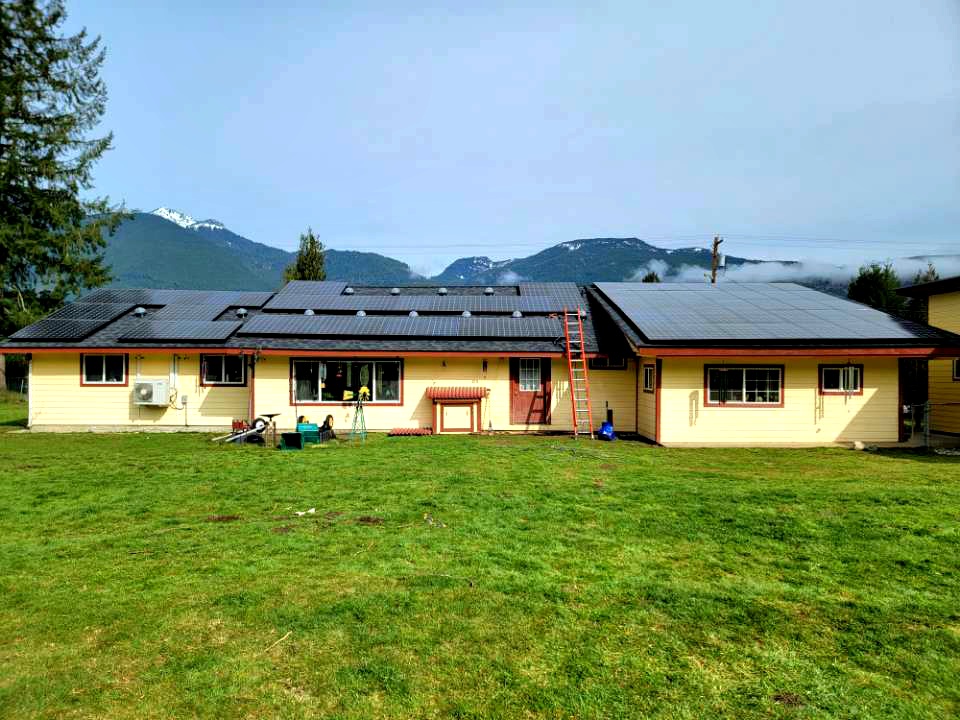
A&R Solar has spent two decades helping Washington and Oregon homeowners navigate the real costs and real savings of going solar. Browse our residential case studies to see how actual homeowners in our region have handled costs, timelines, and incentives. You can also explore recent residential projects for a closer look at what a finished installation looks like. If backup power is a priority, review our battery storage options to see how storage fits into a complete system. Our team is ready to walk you through a personalized cost estimate with no pressure and no guesswork.
Frequently asked questions
What is the average payback period for solar in Washington and Oregon?
Most homeowners see payback in 8 to 13 years, depending on system size, applied incentives, and their annual energy use. Larger, well-designed systems in households with higher electricity consumption tend to recover costs faster.
Are solar panels more expensive in the Pacific Northwest than other US regions?
Not significantly. Washington systems average $2.55 to $3.00 per watt in 2026, compared to the US average of $2.95 per watt. Payback periods are somewhat longer due to cloudier weather and lower baseline electricity rates.
What upfront incentives are available for Oregon homeowners in 2026?
Eligible homeowners receive a $2,500 rebate through the Energy Trust of Oregon, with low-income households qualifying for $0.90 per watt. Property tax exemptions and battery rebates are also available.
How do batteries impact total solar cost?
Batteries add $1,000 to $1,400 per kWh of capacity to your total system cost, but they provide meaningful backup power and can improve bill management for homeowners on time-of-use utility rates.