TL;DR
Your electric bill is more than just a dollar amount—it’s a map of how and when your home uses energy. By understanding the key line items and patterns on your bill, you can see where solar is most likely to make a difference for a typical PNW household.

Intro
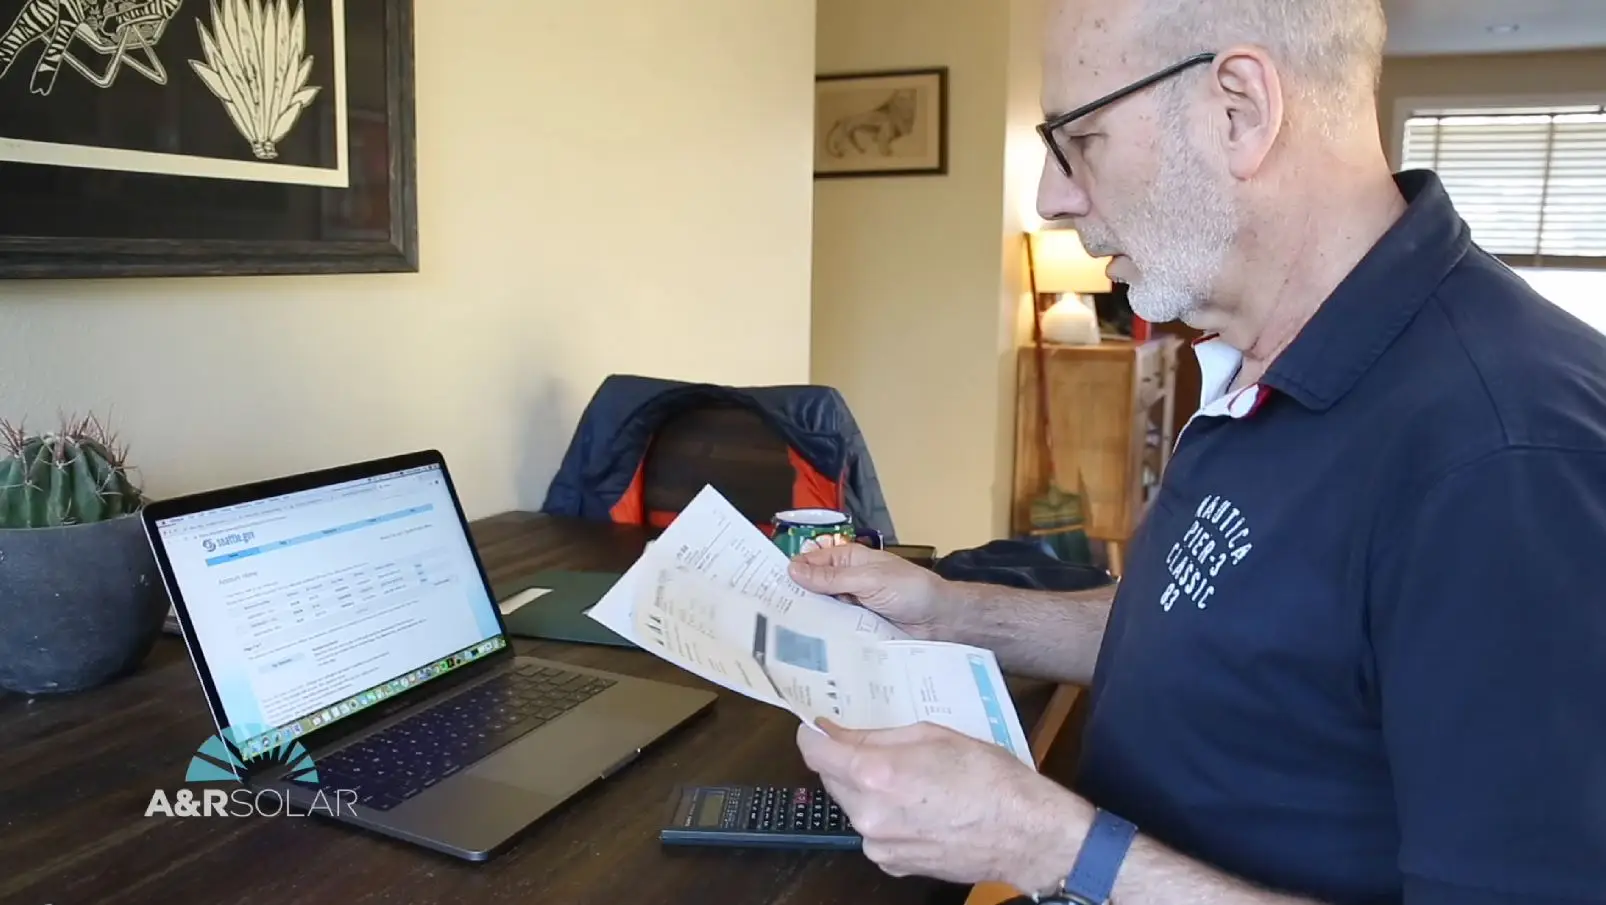
Many homeowners in Washington and Oregon never look at anything beyond the “amount due” on their electric bill. When you’re considering solar, digging a little deeper pays off. This guide walks through the main parts of a typical residential bill and highlights where solar tends to have the biggest impact, so you can have more grounded expectations about savings.
Key Takeaways
- The total kWh you use over a year is the starting point for sizing solar.
- The rate you pay per kWh and any fixed charges shape how savings show up.
- Solar usually reduces the energy portion of your bill but may not eliminate every line item.
- Looking at seasonal patterns helps you see when solar will feel most impactful.
The Most Important Number: Your Annual kWh
When evaluating solar, the single most important number on your bill is your total annual energy consumption, measured in kilowatt-hours (kWh). This tells you how much electricity your home actually uses over time.
You can usually find this by looking at the usage section of each monthly bill and adding up 12 months, or by using an annual summary if your utility provides one. A smaller home might use 6,000–8,000 kWh per year, while a larger home with electric heat or multiple large loads could be much higher.
Knowing your annual kWh gives designers a target. They can then estimate how much of that usage a system on your roof could reasonably cover in a typical PNW year, based on orientation, shading, and equipment.
How Your Rate Per kWh Shapes Savings
Your bill will also show how much you pay per kWh. Some utilities use a flat rate, while others have tiered or time-of-use structures. Understanding this helps you translate solar production into dollar savings.
If you pay a flat rate, the math is relatively straightforward: each kWh your system produces and you use on-site offsets one kWh you would have bought from the utility at that rate, subject to how credits are handled.
If your utility uses tiers or time-of-use pricing, the value of a kWh can change depending on when you use it. In those cases, the timing of your usage and solar production matters more—solar may help you avoid higher-priced tiers or certain peak periods.
A good proposal will take your rate structure into account rather than assuming a single average number.
Fixed Charges and What Solar Doesn’t Replace
Most residential bills in the PNW include fixed charges, such as basic service fees, that you pay regardless of how much electricity you use. Solar can reduce the energy portion of your bill but does not eliminate these fixed line items.
It’s common for homeowners to still see a monthly bill even after installing solar, especially in months with lower production. The goal is to reduce the variable portion of the bill—the part tied to kWh usage—rather than make every bill zero.
Understanding which charges are fixed and which scale with usage helps you avoid disappointment and focus on the part of the bill that solar can realistically affect.
Seasonal Patterns: When Solar Feels the Most Impactful
In Washington and Oregon, many homes use more electricity in the darkest winter months, especially if they rely on electric heat or use more lighting. At the same time, solar production is lower in winter and higher in late spring and summer.
That doesn’t mean solar “fails” in winter; it means you need to think in terms of an annual balance. During high-production months, your system may generate more than you use at times, and depending on your utility’s policies, that surplus can be credited toward usage in other periods.
By comparing your monthly usage pattern to a typical solar production curve, you can get a sense of when solar will feel the most impactful and how credits might help smooth things out.
Closing
An electric bill that once felt like a mystery can become a useful planning tool when you’re considering solar. By focusing on your annual kWh, your rate structure, and the difference between fixed and variable charges, you can see where solar is most likely to save you money.
This week, take 10–15 minutes to gather your last 12 months of bills, total up your kWh usage, and note your highest-usage months. That simple exercise will make any solar conversation much more concrete and tailored to your home in the Pacific Northwest.